Note
Go to the end to download the full example code.
Slice: several meshes scrubbed together
Meshes that share a grid can be sliced in lockstep. With Link all matching axes on, one slider at the bottom of the figure drives every compatible axes at once, so the same row is compared across all of them – the natural way to ask “how does this cut change from one condition to the next?”.
Four snapshots of a diffusing hot spot at increasing times sit on one grid. Drag
the shared slider: the four strips show the same row, and the peak visibly
flattens and widens from the first panel to the last. Every strip uses the
colour scale’s range ("range": "colorbar"), so heights are comparable
between panels and do not rescale as the slider moves – without it each strip
would zoom to its own row and the flattening would be hidden.
Axes with different grids are not linked together; each keeps its own slider.
options={"slice": {"enabled": True, "link_all": True, "range": "colorbar"}}
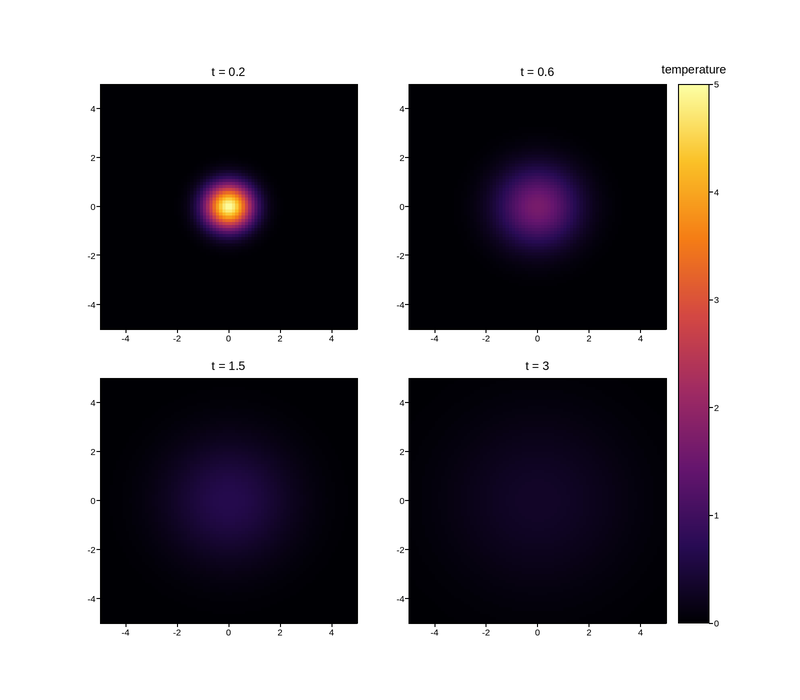
Live figure — pick a tool, then zoom, pan, point-pick or annotate. Nothing is active until a tool is selected.
View this figure’s Vega export ↗ — the raw JSON spec, rendered live by a real Vega engine.
View this figure’s Vega-Lite export ↗ — the raw JSON spec(s), rendered live by a real Vega-Lite engine.
import numpy as np
import plotpress

x = np.linspace(-5, 5, 81)
y = np.linspace(-5, 5, 81)
X, Y = np.meshgrid((x[:-1] + x[1:]) / 2, (y[:-1] + y[1:]) / 2)
times = [0.2, 0.6, 1.5, 3.0]

fig, axs = plotpress.subplots(2, 2, figsize=(8, 7))
for ax, t in zip(axs.ravel(), times):
    heat = np.exp(-(X ** 2 + Y ** 2) / (4 * t)) / t
    mesh = ax.pcolormesh(x, y, heat, cmap="inferno", vmin=0, vmax=5)
    ax.set_title(f"t = {t:g}")
fig.colorbar(mesh, ax=list(axs.ravel()), label="temperature")

_gallery_interactive_options = {"slice": {
    "enabled": True, "link_all": True, "range": "colorbar", "index": 40}}
Total running time of the script: (0 minutes 0.148 seconds)