Note
Go to the end to download the full example code.
Pcolormesh
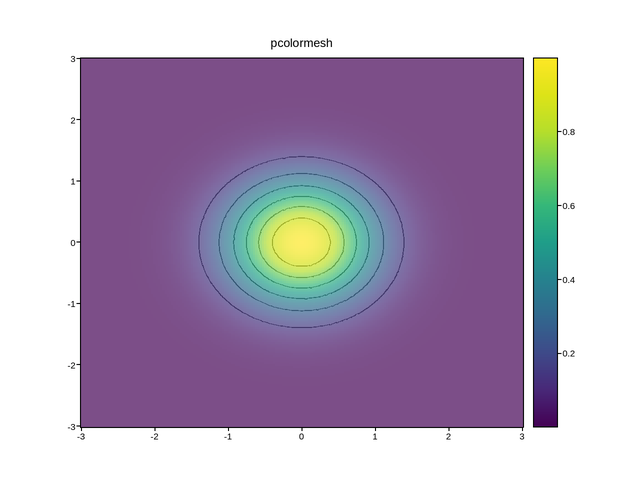
alpha blends the mesh into whatever is drawn underneath it – here, a
contour of the same field laid down first stays visible through it.
Live figure — pick a tool, then zoom, pan, point-pick or annotate. Nothing is active until a tool is selected.
View this figure’s Vega export ↗ — the raw JSON spec, rendered live by a real Vega engine.
View this figure’s Vega-Lite export ↗ — the raw JSON spec(s), rendered live by a real Vega-Lite engine.
import numpy as np
import plotpress

g = np.linspace(-3, 3, 200)
X, Y = np.meshgrid(g, g)
Z = np.exp(-(X ** 2 + Y ** 2))
fig, ax = plotpress.subplots()
ax.contour(g, g, Z, levels=6, colors=["#333333"])
m = ax.pcolormesh(g, g, Z, cmap="viridis", alpha=0.7, label="density")
ax.set_title("pcolormesh"); fig.colorbar(m, ax=ax)
Total running time of the script: (0 minutes 2.752 seconds)