Note
Go to the end to download the full example code.
Contour lines
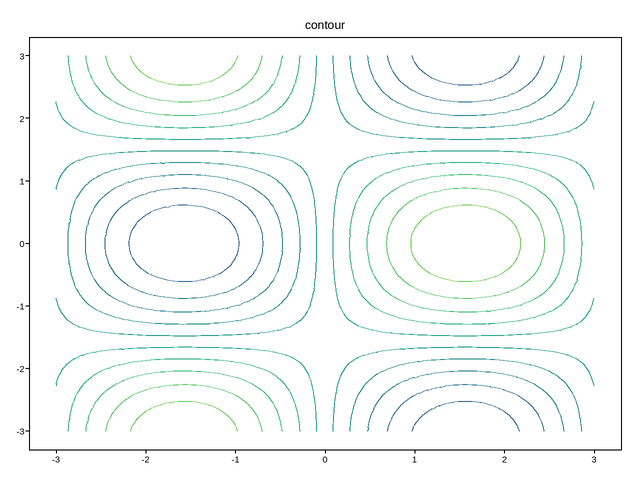
Marching-squares contours of a 2-D field. Each level’s own color comes from
its value, normalized by vmin/vmax – the same normalization
pcolormesh/contourf use over the same field, so an explicit
vmin/vmax colors contour lines consistently with a filled version
of it (here, wider than Z’s own +-1 range, so every line sits well
inside the colormap rather than spanning its full extent).
Live figure — pick a tool, then zoom, pan, point-pick or annotate. Nothing is active until a tool is selected.
import numpy as np
import plotpress

g = np.linspace(-3, 3, 120)
X, Y = np.meshgrid(g, g)
Z = np.sin(X) * np.cos(Y)
fig, ax = plotpress.subplots()
ax.contour(g, g, Z, levels=10, vmin=-2, vmax=2)
ax.set_title("contour")
fig.tight_layout()
Total running time of the script: (0 minutes 1.768 seconds)