Note
Go to the end to download the full example code.
Small mesh: real data in the Vega/Vega-Lite export
Figure.to_vega()/to_vega_lite() normally embed a pcolormesh as a
single rasterized image – a picture of the data, frozen at whatever color
scale existed at export time. For a mesh small enough to stay cheap (at most
~2000 cells, a rectilinear grid, a plain linear color norm, and a colormap
with a matching named Vega scheme – this one easily qualifies at 10x8 = 80
cells), mesh_data=True embeds the real per-cell values instead, as
genuine field/scale-encoded marks: reactive to a downstream color
scale change, and queryable by anything reading the spec, not just a
picture of the result.
This page’s own Vega/Vega-Lite export links (below the gallery image) show
that live: open either one and each mesh cell is a real rect, not a
<image> – unlike the large mesh in the plain pcolormesh example,
which stays a rasterized image regardless, above the cell limit where a
per-cell export would stop being cheap.
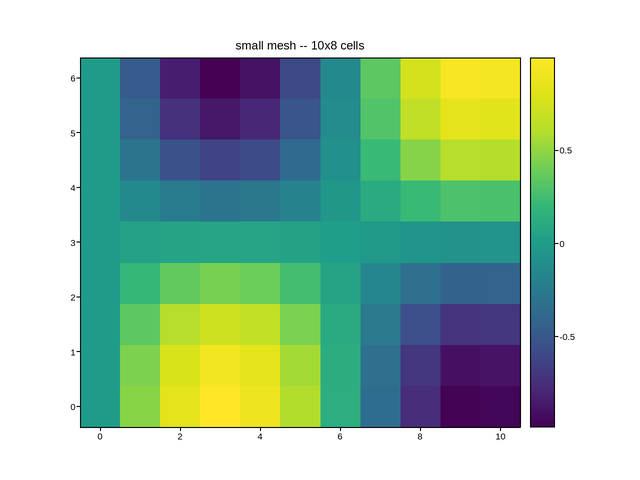
Live figure — pick a tool, then zoom, pan, point-pick or annotate. Nothing is active until a tool is selected.
View this figure’s Vega export ↗ — the raw JSON spec, rendered live by a real Vega engine.
View this figure’s Vega-Lite export ↗ — the raw JSON spec(s), rendered live by a real Vega-Lite engine.
import numpy as np
import plotpress

x = np.linspace(0, 10, 11)
y = np.linspace(0, 6, 9)
X, Y = np.meshgrid(x, y)
Z = np.sin(X / 2) * np.cos(Y / 2)

fig, ax = plotpress.subplots()
mesh = ax.pcolormesh(x, y, Z, cmap="viridis")
ax.set_title("small mesh -- 10x8 cells")
fig.colorbar(mesh, ax=ax)
Total running time of the script: (0 minutes 0.109 seconds)