Note
Go to the end to download the full example code.
Slice: columns, and the profile in the heatmap’s place
The same tool sliced the other way. Slice Y cuts a column instead of a row, and the Slice view radio chooses where the profile is drawn: in a strip beside the heatmap (the default), in place of the heatmap, or not at all, leaving just a dashed cursor on the heatmap. “Profile replaces heatmap” gives the line the whole axes, which is the view to use when the values matter more than the picture around them.
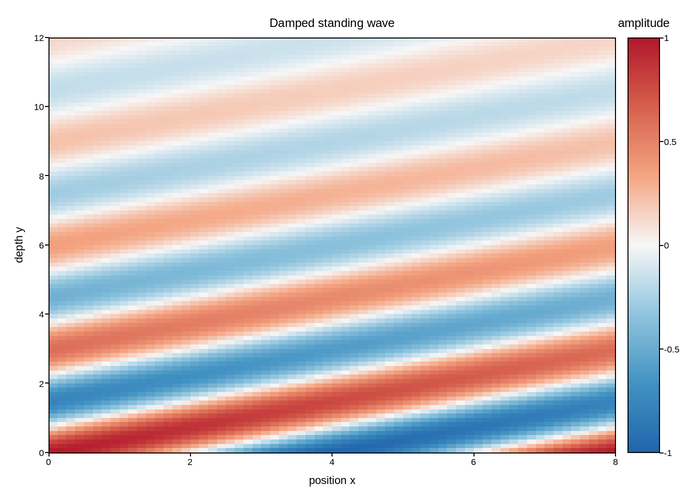
The field is a damped standing wave along y that drifts across x. Columns
therefore show a clean decaying oscillation, and stepping the slider moves the
phase. Gridlines on profile (on by default, and also settable up front with
"grid": False) puts light lines at the value ticks and at the heatmap’s own
ticks, so a value can be read straight across.
options={"slice": {"enabled": True, "orientation": "y",
                   "view": "replace", "index": 12, "grid": True}}
Live figure — pick a tool, then zoom, pan, point-pick or annotate. Nothing is active until a tool is selected.
View this figure’s Vega export ↗ — the raw JSON spec, rendered live by a real Vega engine.
View this figure’s Vega-Lite export ↗ — the raw JSON spec(s), rendered live by a real Vega-Lite engine.
import numpy as np
import plotpress

x = np.linspace(0, 8, 65)
y = np.linspace(0, 12, 97)
X, Y = np.meshgrid((x[:-1] + x[1:]) / 2, (y[:-1] + y[1:]) / 2)
field = np.exp(-Y / 6) * np.cos(2 * np.pi * (Y / 3 - X / 8))

fig, ax = plotpress.subplots(figsize=(7, 5))
mesh = ax.pcolormesh(x, y, field, cmap="RdBu_r", vmin=-1, vmax=1)
ax.set_xlabel("position x")
ax.set_ylabel("depth y")
ax.set_title("Damped standing wave")
fig.colorbar(mesh, ax=ax, label="amplitude")
fig.tight_layout()

_gallery_interactive_options = {"slice": {
    "enabled": True, "orientation": "y", "view": "replace", "index": 12, "grid": True}}
Total running time of the script: (0 minutes 0.130 seconds)