Note
Go to the end to download the full example code.
Colormap reference
Every colormap plotpress.get_cmap() knows by name, grouped the way
matplotlib’s own reference page groups them – each bar is a plain
horizontal gradient through that map, labelled with the name cmap=
takes. Append "_r" to any of them to reverse it.
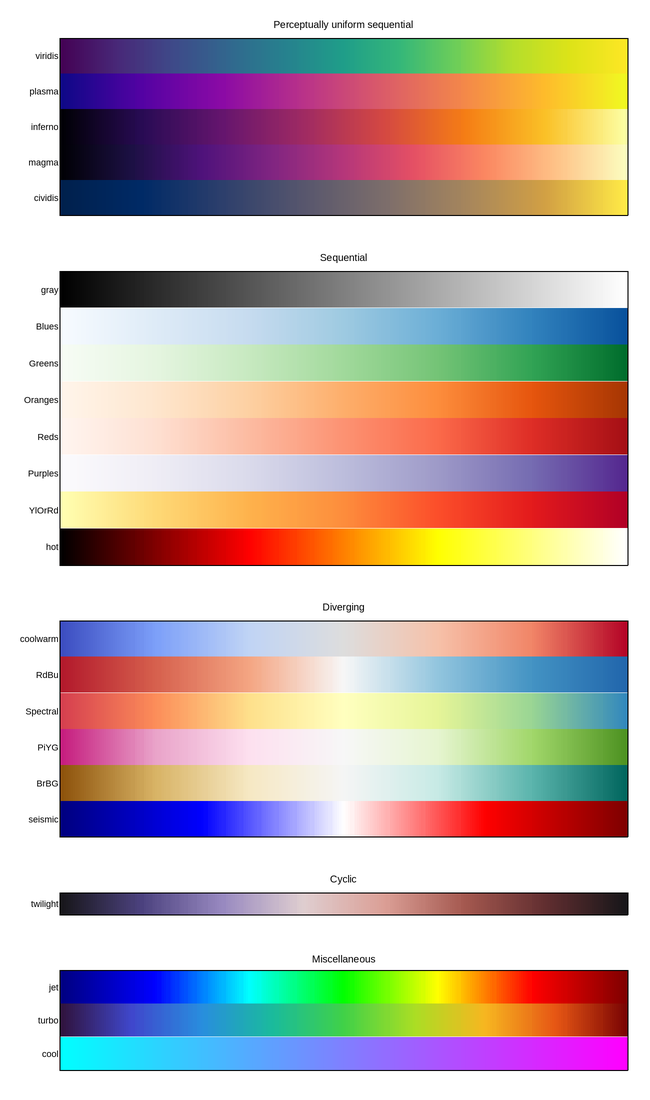
Live figure — pick a tool, then zoom, pan, point-pick or annotate. Nothing is active until a tool is selected.
View this figure’s Vega export ↗ — the raw JSON spec, rendered live by a real Vega engine.
View this figure’s Vega-Lite export ↗ — the raw JSON spec(s), rendered live by a real Vega-Lite engine.
import numpy as np
import plotpress

CATEGORIES = [
    ("Perceptually uniform sequential",
     ["viridis", "plasma", "inferno", "magma", "cividis"]),
    ("Sequential",
     ["gray", "Blues", "Greens", "Oranges", "Reds", "Purples", "YlOrRd", "hot"]),
    ("Diverging",
     ["coolwarm", "RdBu", "Spectral", "PiYG", "BrBG", "seismic"]),
    ("Cyclic",
     ["twilight"]),
    ("Miscellaneous",
     ["jet", "turbo", "cool"]),
]

gradient = np.linspace(0, 1, 256).reshape(1, -1)
total_rows = sum(len(names) for _, names in CATEGORIES) + len(CATEGORIES) - 1

fig = plotpress.Figure(figsize=(6.5, 11))
gs = fig.add_gridspec(total_rows, 1)
row = 0
for title, names in CATEGORIES:
    n = len(names)
    ax = fig.add_subplot(gs[row:row + n, 0])
    for i, name in enumerate(names):
        top = n - i
        ax.imshow(gradient, cmap=name, extent=(0, 1, top - 1, top))
    ax.set_xlim(0, 1)
    ax.set_ylim(0, n)
    ax.set_xticks([])
    ax.set_yticks([n - i - 0.5 for i in range(n)])
    ax.set_yticklabels(names)
    ax.tick_params(length=0)
    ax.set_title(title, fontsize=10)
    row += n + 1

fig.tight_layout()
Total running time of the script: (0 minutes 0.260 seconds)