Note
Go to the end to download the full example code.
Galaxy rotation curve and the missing mass
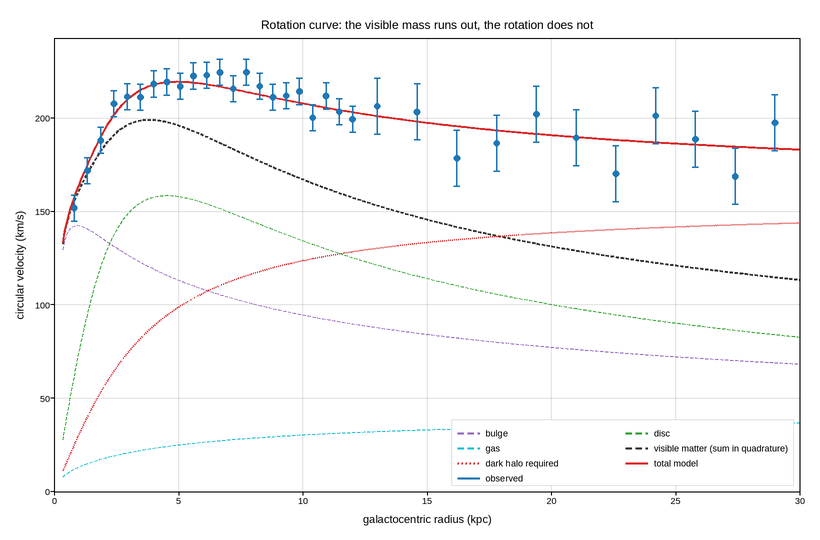
Orbital speed against radius in a spiral galaxy, with the contribution of each mass component drawn separately. This is the figure that made dark matter a mainstream idea, and it works because it is a decomposition: the measurement is one curve, but the argument is that no combination of the visible components reproduces it.
So the visible components are drawn as dashed lines, the total of the visible matter as a heavier dashed line, and the observed velocities as points with their measurement errors. The gap between the last dashed line and the points at large radius is the entire content of the plot, which is why the halo needed to close it is drawn too, in a contrasting colour.
Error bars matter here more than usual. The outer points come from neutral hydrogen rather than optical spectroscopy and are individually noisier, but they are also where the discrepancy lives – so the reader has to be able to see that the gap is many sigma wide, not one noisy point. Velocities add in quadrature, which is why the total is a root-sum-square of the components rather than a sum.
Live figure — pick a tool, then zoom, pan, point-pick or annotate. Nothing is active until a tool is selected.
View this figure’s Vega export ↗ — the raw JSON spec, rendered live by a real Vega engine.
View this figure’s Vega-Lite export ↗ — the raw JSON spec(s), rendered live by a real Vega-Lite engine.
import numpy as np
import polars as pl
import plotpress

rng = np.random.default_rng(1933)

r = np.linspace(0.35, 30.0, 400)                  # kpc

# Bulge: compact, falls off Keplerian once you are outside it.
v_bulge = 210.0 * np.sqrt(r / (r + 0.6) ** 1.65)
# Disc: rises, peaks near two scale lengths, then declines.
v_disc = 165.0 * np.sqrt((r / 3.2) ** 2 / (1.0 + (r / 3.2) ** 2) ** 1.5) * 1.55
# Gas: minor, and only matters far out.
v_gas = 42.0 * np.sqrt(r / (r + 9.0))
# Dark halo: an isothermal sphere, flat at large radius.
v_halo = 155.0 * np.sqrt(1.0 - (2.8 / r) * np.arctan(r / 2.8))

v_visible = np.sqrt(v_bulge ** 2 + v_disc ** 2 + v_gas ** 2)
v_total = np.sqrt(v_visible ** 2 + v_halo ** 2)

# One row per model radius -- the shape a mass-decomposition model's own
# output table is in, before it is compared against the observations.
model = pl.DataFrame({
    "r": r, "v_bulge": v_bulge, "v_disc": v_disc, "v_gas": v_gas,
    "v_visible": v_visible, "v_halo": v_halo, "v_total": v_total,
})
r = model["r"].to_numpy()
v_bulge = model["v_bulge"].to_numpy()
v_disc = model["v_disc"].to_numpy()
v_gas = model["v_gas"].to_numpy()
v_visible = model["v_visible"].to_numpy()
v_halo = model["v_halo"].to_numpy()
v_total = model["v_total"].to_numpy()

# Observations: optical rotation inside 12 kpc, HI beyond, noisier and sparser.
r_opt = np.linspace(0.8, 12.0, 22)
r_hi = np.linspace(13.0, 29.0, 11)

# One row per telescope pointing -- the shape a rotation-curve survey's own
# observation log is in, before it is overlaid on the mass model.
r_obs = np.concatenate([r_opt, r_hi])
err = np.concatenate([np.full(r_opt.size, 7.0), np.full(r_hi.size, 15.0)])
observations = pl.DataFrame({
    "r": r_obs, "err": err, "v_obs": np.interp(r_obs, r, v_total) + rng.normal(0.0, err),
})
r_obs = observations["r"].to_numpy()
err = observations["err"].to_numpy()
v_obs = observations["v_obs"].to_numpy()

fig, ax = plotpress.subplots(figsize=(8.2, 5.4))
ax.plot(r, v_bulge, color="#9467bd", linestyle="--", linewidth=1.2, label="bulge")
ax.plot(r, v_disc, color="#2ca02c", linestyle="--", linewidth=1.2, label="disc")
ax.plot(r, v_gas, color="#17becf", linestyle="--", linewidth=1.2, label="gas")
ax.plot(r, v_visible, color="#333333", linestyle="--", linewidth=1.8,
        label="visible matter (sum in quadrature)")
ax.plot(r, v_halo, color="#d62728", linestyle=":", linewidth=1.6,
        label="dark halo required")
ax.plot(r, v_total, color="#d62728", linewidth=2.0, label="total model")
ax.errorbar(r_obs, v_obs, yerr=err, color="#1f77b4", marker="o", markersize=4.5,
            linestyle="none", capsize=3.0, label="observed")

ax.set_xlim(0.0, 30.0)
ax.set_ylim(0.0, None)
ax.set_xlabel("galactocentric radius (kpc)")
ax.set_ylabel("circular velocity (km/s)")
ax.set_title("Rotation curve: the visible mass runs out, the rotation does not")
ax.legend(loc="lower right", ncol=2)
ax.grid(True)
fig.tight_layout()
Total running time of the script: (0 minutes 0.155 seconds)