Note
Go to the end to download the full example code.
Folding a pulsar: signal-to-noise improving pulse by pulse
A pulsar’s pulse is far too faint to see in a single rotation – the technique that makes pulsar timing possible at all is folding: chop the receiver’s output into one segment per rotation period and average them together, phase-locked to the (independently known) period. Each individual rotation looks like pure noise; the pulse only emerges once enough of them have been stacked, which is why this animation, not a finished folded profile, is the honest picture of the measurement.
Averaging N independent noisy copies of the same signal suppresses the
noise by sqrt(N) while the signal itself, being identical every period,
adds coherently – so the signal-to-noise ratio of the folded profile grows
as sqrt(N). That square root is the reason the pulse’s emergence
visibly slows down even as more and more pulses go into it: doubling the
integration time from 200 pulses to 400 buys far less clarity than doubling
it from 5 to 10 did.
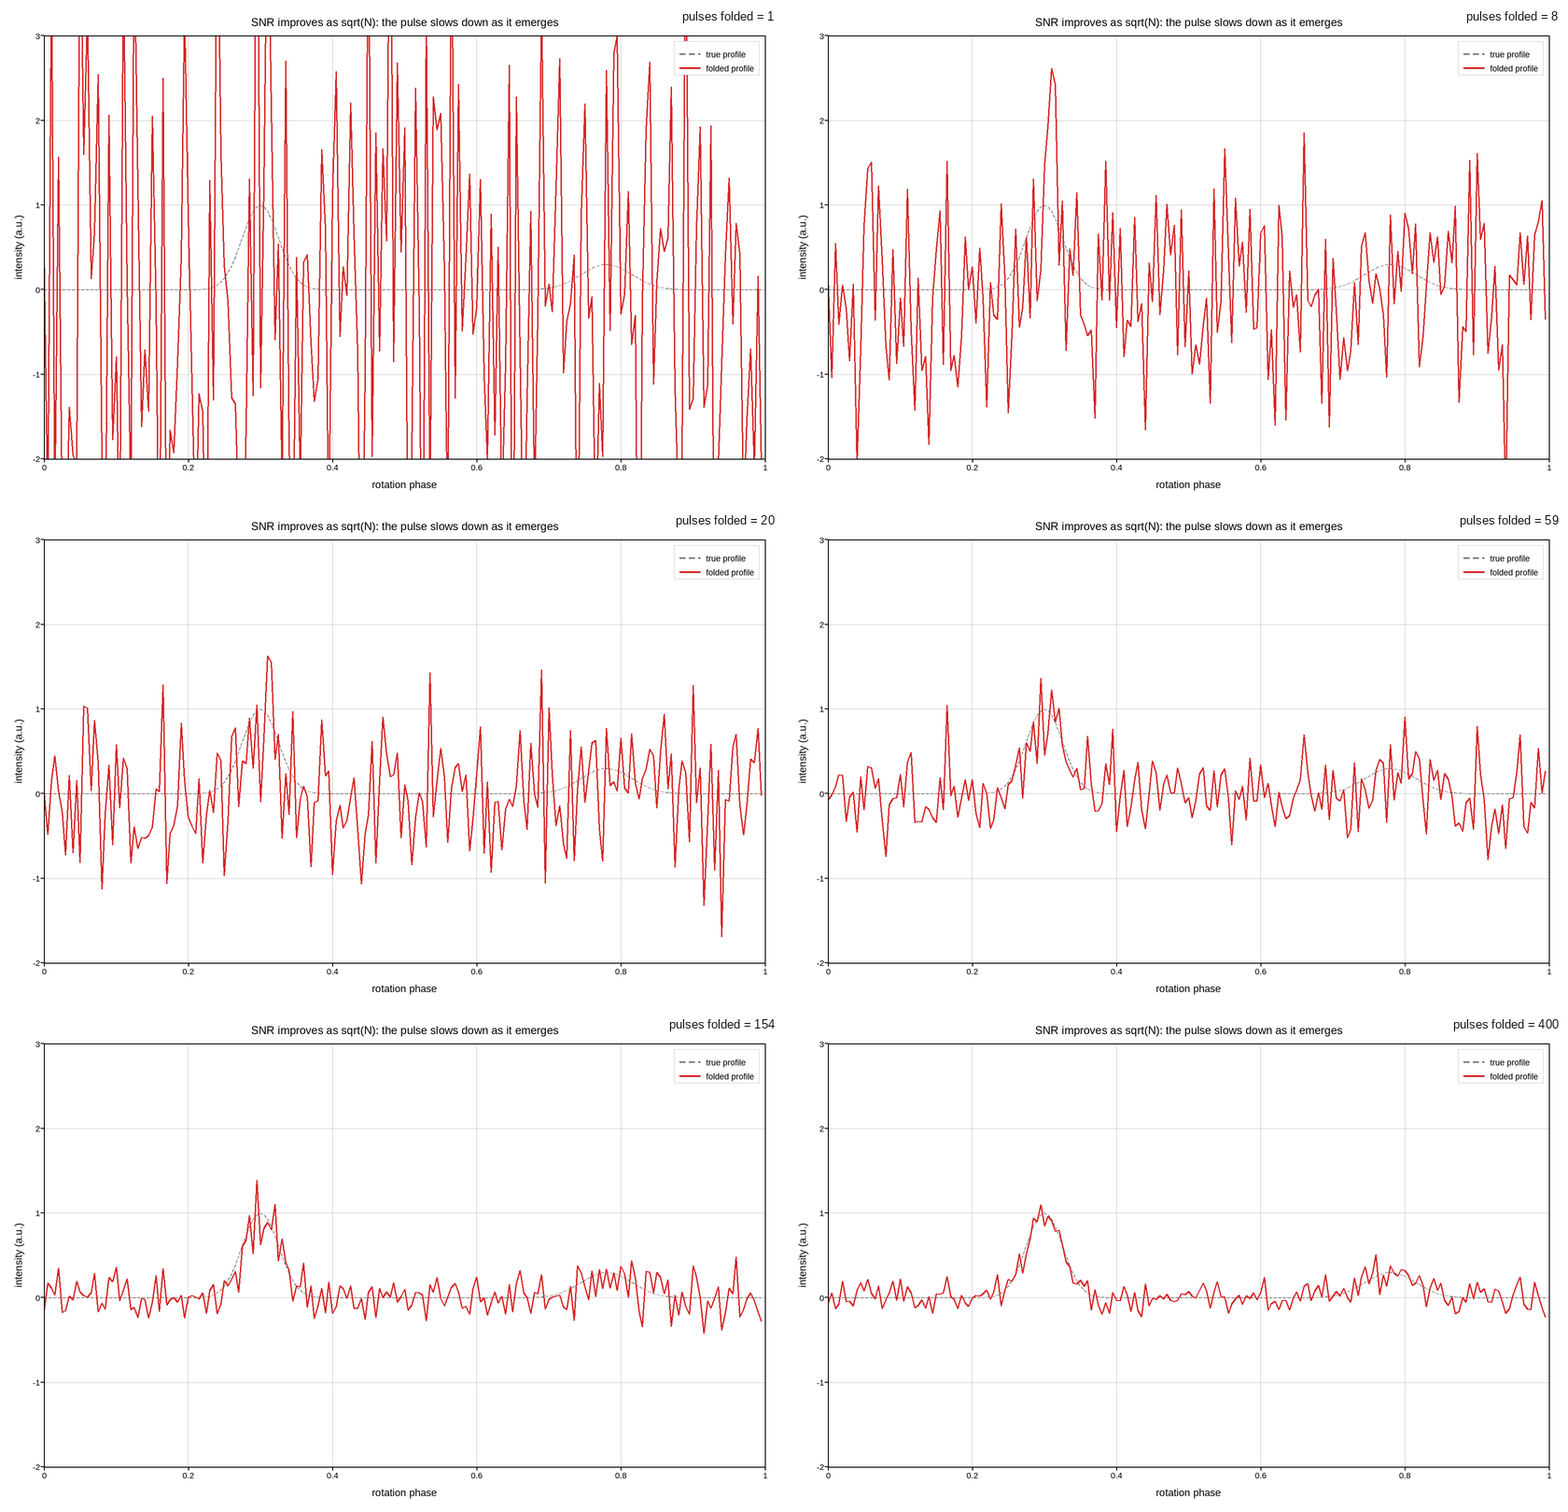
Live figure — pick a tool, then zoom, pan, point-pick or annotate. Nothing is active until a tool is selected.
View this figure’s Vega export ↗ — the raw JSON spec, rendered live by a real Vega engine.
View this figure’s Vega-Lite export ↗ — the raw JSON spec(s), rendered live by a real Vega-Lite engine.
import os
import tempfile

import numpy as np
import plotpress

rng = np.random.default_rng(2001)

N_PHASE = 200
phase = np.linspace(0.0, 1.0, N_PHASE, endpoint=False)


def gaussian(p, centre, amp, width):
    d = np.abs(p - centre)
    d = np.minimum(d, 1.0 - d)                       # phase wraps at 1
    return amp * np.exp(-(d ** 2) / (2 * width ** 2))


# A main pulse and a fainter interpulse -- the double-peaked profile several
# real pulsars (the Crab among them) actually show.
true_profile = gaussian(phase, 0.30, 1.0, 0.025) + gaussian(phase, 0.78, 0.30, 0.035)

N_PULSES = 400
NOISE_SIGMA = 2.2
individual = rng.normal(0.0, NOISE_SIGMA, (N_PULSES, N_PHASE)) + true_profile[None, :]

N_FRAMES = 45
checkpoints = np.unique(np.round(np.logspace(0, np.log10(N_PULSES), N_FRAMES)).astype(int))
folded = np.stack([individual[:n].mean(axis=0) for n in checkpoints])

fig, ax = plotpress.subplots(figsize=(8.4, 5.4))
ax.plot(phase, true_profile, color="#888888", linestyle="--", linewidth=1.2,
        label="true profile")
ax.plot_frames(phase, folded, slider_values=checkpoints.astype(float),
              slider_label="pulses folded", color="#d62728", label="folded profile")
ax.set_xlim(0.0, 1.0)
ax.set_ylim(-2.0, 3.0)
ax.set_xlabel("rotation phase")
ax.set_ylabel("intensity (a.u.)")
ax.set_title("SNR improves as sqrt(N): the pulse slows down as it emerges")
ax.legend(loc="upper right")
ax.grid(True)
fig.tight_layout()

gif_path = os.path.join(tempfile.gettempdir(), "plotpress_pulsar_folding.gif")
fig.save(gif_path, fps=6)
Total running time of the script: (0 minutes 6.906 seconds)