Note
Go to the end to download the full example code.
MOSFET output characteristics, swept smoothly in gate voltage
The same square-law MOSFET model as MOSFET output characteristics, at six gate voltages there and at fifty here, animated as a continuous sweep rather than six discrete curves. The underlying physics does not change –
I_d = K (V_ov V_ds - V_ds^2 / 2), V_ds < V_ov (linear) I_d = (K/2) V_ov^2 (1 + lambda (V_ds - V_ov)), V_ds >= V_ov (saturation)
with overdrive V_ov = V_gs - V_th – but watching the curve grow
continuously rather than comparing six static traces makes the family’s
defining relationship visible as motion: the knee separating the linear and
saturation regions traces out V_ds = V_gs - V_th as a moving point, not
a dashed line that has to be drawn in and explained separately.
The curve does not move at a constant rate. Drain current depends on the
square of the overdrive, so equal steps in gate voltage produce
increasingly large jumps in the saturation current – the animation visibly
accelerates even though V_gs itself is stepped evenly.
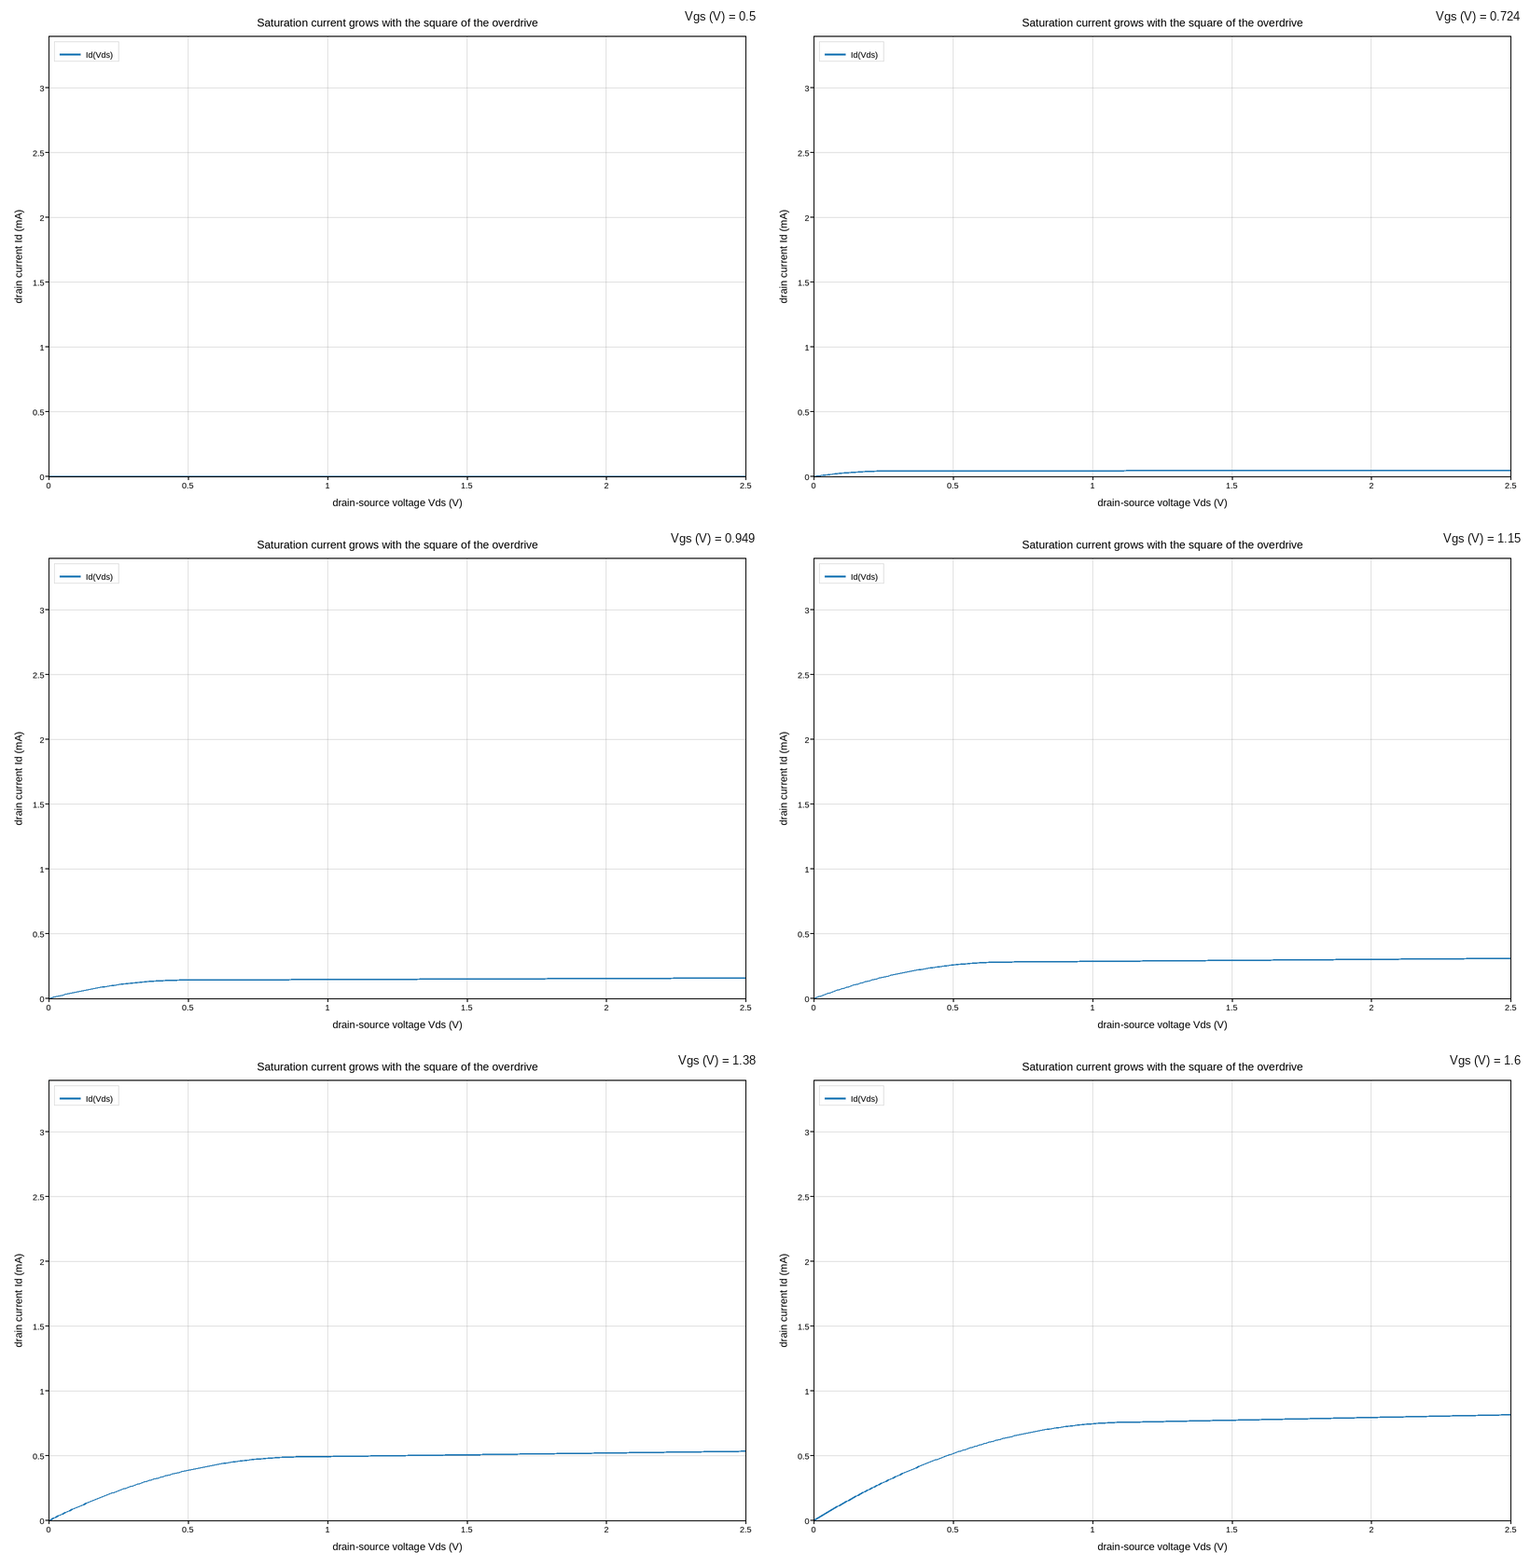
Live figure — pick a tool, then zoom, pan, point-pick or annotate. Nothing is active until a tool is selected.
import os
import tempfile

import numpy as np
import plotpress

V_TH = 0.45
K = 1.15e-3
LAMBDA = 0.055

vds = np.linspace(0.0, 2.5, 300)
vgs_values = np.linspace(0.5, 1.6, 50)

ids = np.empty((vgs_values.size, vds.size))
for f, vgs in enumerate(vgs_values):
    overdrive = max(vgs - V_TH, 1e-9)
    linear = K * (overdrive * vds - 0.5 * vds ** 2)
    saturation = 0.5 * K * overdrive ** 2 * (1.0 + LAMBDA * (vds - overdrive))
    ids[f] = np.where(vds < overdrive, linear, saturation)

fig, ax = plotpress.subplots(figsize=(8.2, 5.6))
ax.plot_frames(vds, ids * 1e3, slider_values=vgs_values, slider_label="Vgs (V)",
              color="#1f77b4", label="Id(Vds)")
ax.set_xlim(0.0, 2.5)
ax.set_ylim(0.0, 3.4)
ax.set_xlabel("drain-source voltage Vds (V)")
ax.set_ylabel("drain current Id (mA)")
ax.set_title("Saturation current grows with the square of the overdrive")
ax.legend(loc="upper left")
ax.grid(True)
fig.tight_layout()

gif_path = os.path.join(tempfile.gettempdir(), "plotpress_mosfet_sweep.gif")
fig.save(gif_path, fps=12)
Total running time of the script: (0 minutes 10.357 seconds)