Note
Go to the end to download the full example code.
MOSFET output characteristics
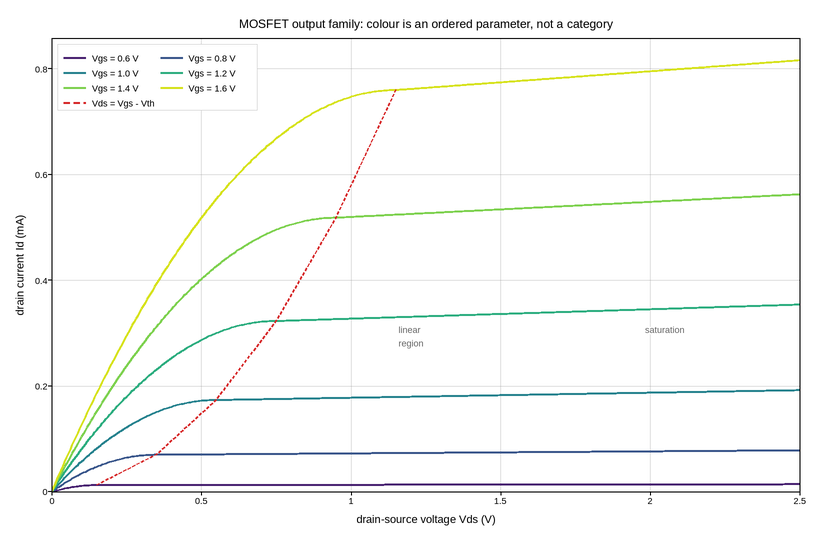
Drain current against drain voltage for a family of gate biases – the first measurement made on any new transistor, and the one every compact model is fitted to. Six curves, one per gate voltage, on shared axes because the family is the measurement: a single curve tells you almost nothing, while the spacing between curves is the transconductance and the slope of their flat sections is the output conductance.
Colour is doing real work. The curves are ordered by gate voltage, so they are coloured by sampling a perceptually uniform colormap rather than taking the categorical cycle – the series are levels of one continuous parameter, not unrelated categories, and a viridis ramp says that where red-blue-green does not. It also survives being printed in greyscale, which the categorical cycle does not.
The boundary between the linear and saturation regions is drawn as a curve
rather than described. Its equation is Vds = Vgs - Vth, so it is a locus
across the family, and drawing it puts the reason the curves bend where they do
directly on the figure.
Live figure — pick a tool, then zoom, pan, point-pick or annotate. Nothing is active until a tool is selected.
View this figure’s Vega export ↗ — the raw JSON spec, rendered live by a real Vega engine.
View this figure’s Vega-Lite export ↗ — the raw JSON spec(s), rendered live by a real Vega-Lite engine.
import numpy as np
import polars as pl
import plotpress

V_TH = 0.45                                        # threshold voltage (V)
K = 1.15e-3                                        # transconductance parameter (A/V^2)
LAMBDA = 0.055                                     # channel-length modulation (1/V)

vds = np.linspace(0.0, 2.5, 400)
vgs_values = np.array([0.6, 0.8, 1.0, 1.2, 1.4, 1.6])

lut = plotpress.get_cmap("viridis")
colors = ["#%02x%02x%02x" % tuple(lut[i])
          for i in np.linspace(20, 225, vgs_values.size).astype(int)]

fig, ax = plotpress.subplots(figsize=(8.2, 5.4))

# One row per (Vgs, Vds) sweep point -- the shape a parameter analyser's own
# I-V sweep is in, before one curve per gate bias is picked out of it.
sweeps = []
for vgs in vgs_values:
    overdrive = vgs - V_TH
    if overdrive <= 0:
        continue
    linear = K * (overdrive * vds - 0.5 * vds ** 2)
    saturation = 0.5 * K * overdrive ** 2 * (1.0 + LAMBDA * (vds - overdrive))
    ids = np.where(vds < overdrive, linear, saturation)
    sweeps.append(pl.DataFrame({"vgs": vgs, "vds": vds, "ids": ids}))
family = pl.concat(sweeps)

knee_v, knee_i = [], []
for vgs, color in zip(vgs_values, colors):
    overdrive = vgs - V_TH
    if overdrive <= 0:
        continue
    run = family.filter(pl.col("vgs") == vgs)
    ax.plot(run["vds"].to_numpy(), run["ids"].to_numpy() * 1e3, color=color,
            linewidth=1.8, label=f"Vgs = {vgs:.1f} V")
    knee_v.append(overdrive)
    knee_i.append(0.5 * K * overdrive ** 2 * 1e3)

ax.plot(knee_v, knee_i, color="#d62728", linestyle="--", linewidth=1.4,
        label="Vds = Vgs - Vth")
ax.text(1.20, 0.30, "linear\nregion", fontsize=9, color="#666666", ha="center")
ax.text(2.05, 0.30, "saturation", fontsize=9, color="#666666", ha="center")

ax.set_xlim(0.0, 2.5)
ax.set_ylim(0.0, None)
ax.set_xlabel("drain-source voltage Vds (V)")
ax.set_ylabel("drain current Id (mA)")
ax.set_title("MOSFET output family: colour is an ordered parameter, not a category")
ax.legend(loc="upper left", ncol=2)
ax.grid(True)
fig.tight_layout()
Total running time of the script: (0 minutes 0.158 seconds)