Note
Go to the end to download the full example code.
The Rabi chevron, one detuning at a time
Qubit Rabi chevron draws the full chevron as a single 2-D map, population against both drive detuning and pulse duration at once. This is the same data taken apart into its individual line cuts and animated across detuning – the way a Rabi calibration is actually acquired, one detuning’s oscillation trace per shot sequence, before anyone assembles a heatmap.
P_e = Omega^2 / Omega_eff^2 sin^2(Omega_eff t / 2), Omega_eff = sqrt(Omega^2 + Delta^2),
with a fixed drive amplitude Omega. On resonance (Delta = 0) the
oscillation reaches full contrast, sweeping all the way from ground to
excited and back; move away from resonance and two things happen together,
not separately – the oscillation speeds up, since Omega_eff grows, and
its amplitude shrinks, since less of it projects onto the excited state.
Watching a single cut lose contrast while speeding up is a clearer read of
that trade-off than tracing a diagonal fringe across the finished 2-D map.
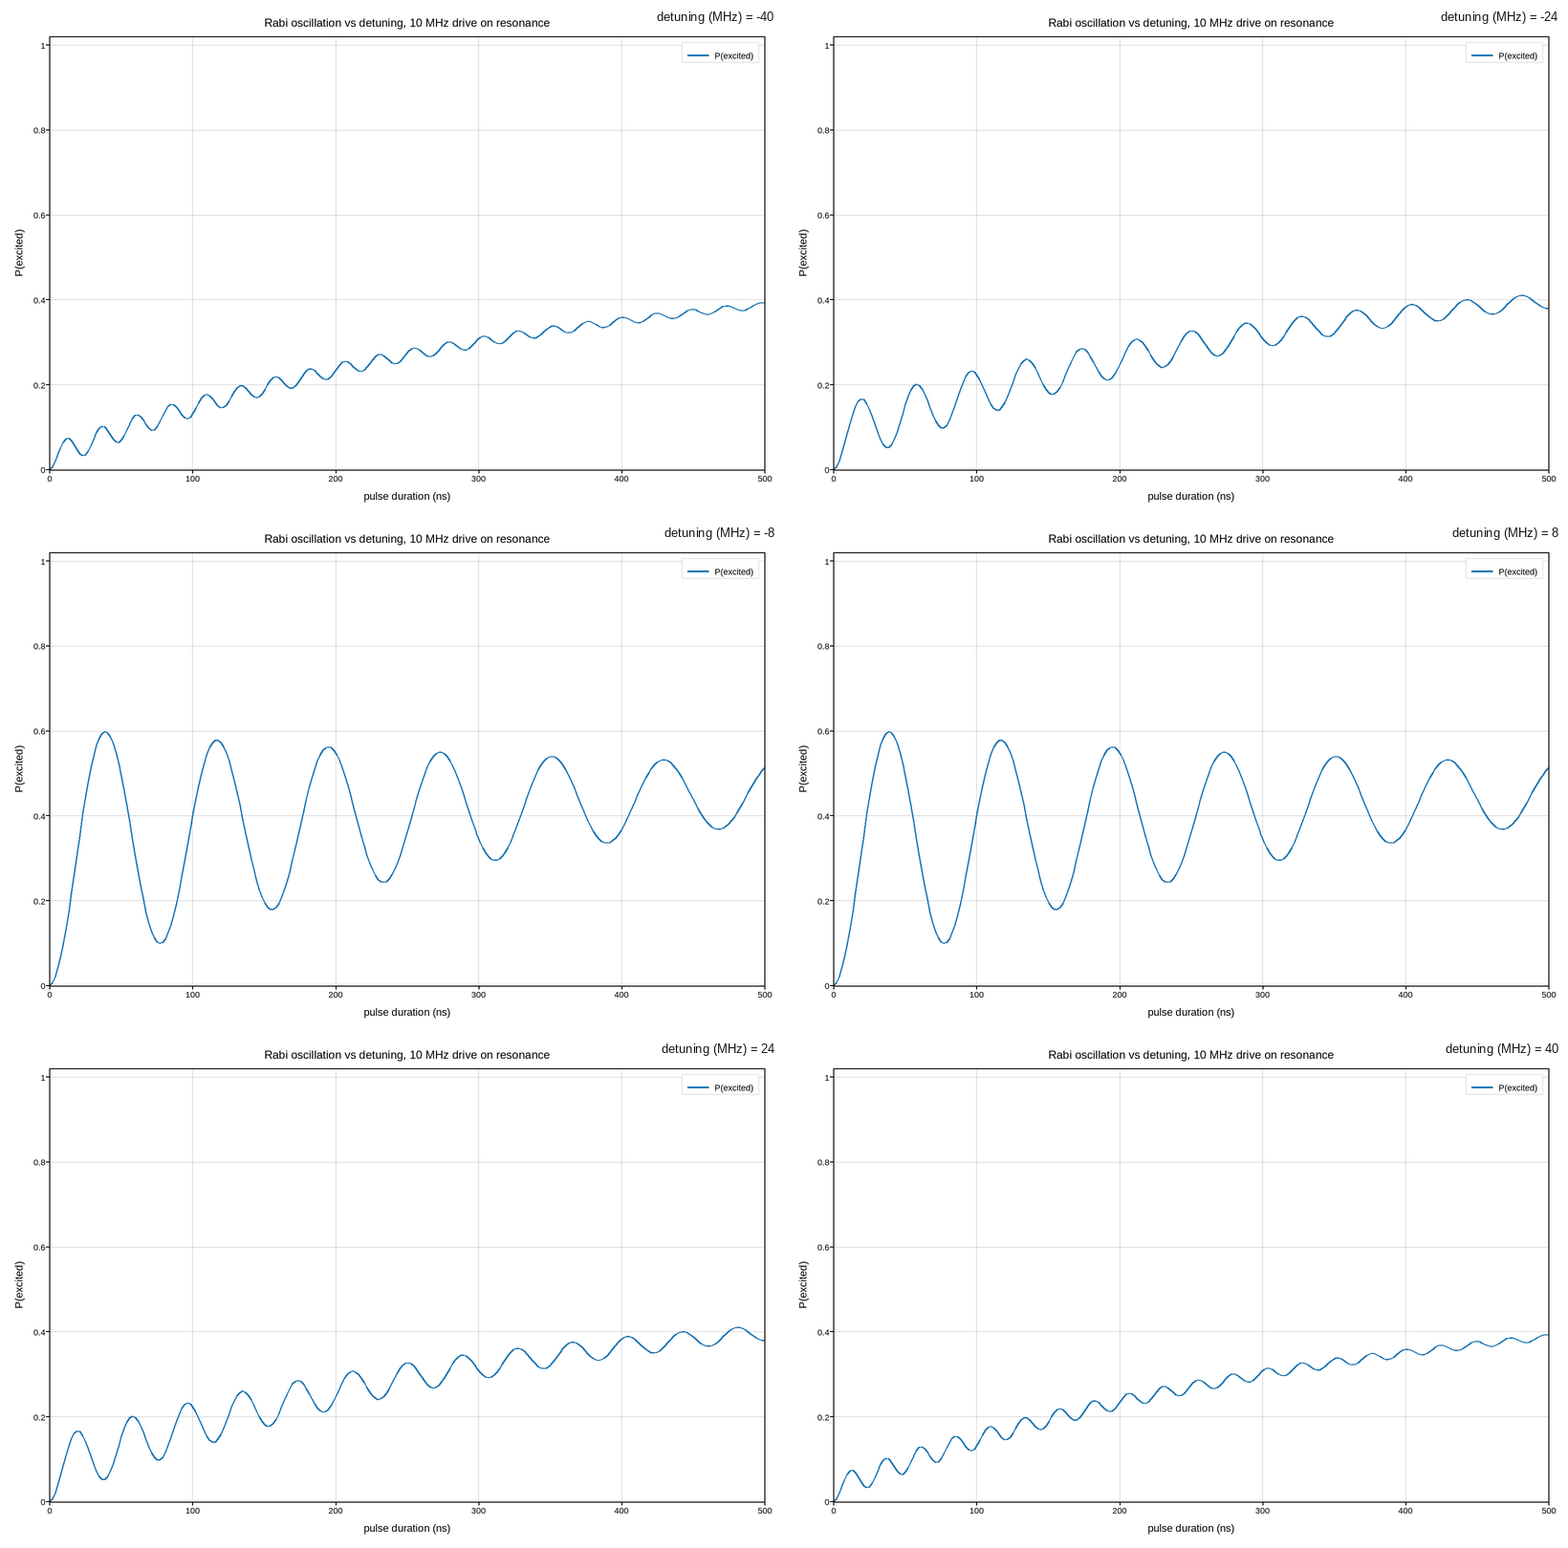
Live figure — pick a tool, then zoom, pan, point-pick or annotate. Nothing is active until a tool is selected.
import os
import tempfile

import numpy as np
import plotpress

RABI_MHZ = 10.0
T2_US = 0.35

duration = np.linspace(0.0, 0.5, 260)                # microseconds
detuning = np.linspace(-40.0, 40.0, 41)               # MHz, one cut per frame

omega = 2.0 * np.pi * RABI_MHZ
DELTA, T = np.meshgrid(2.0 * np.pi * detuning, duration, indexing="ij")
omega_eff = np.hypot(omega, DELTA)
contrast = np.exp(-T / T2_US)
p_excited = 0.5 + contrast * (
    (omega ** 2 / omega_eff ** 2) * np.sin(omega_eff * T / 2.0) ** 2 - 0.5)

fig, ax = plotpress.subplots(figsize=(8.2, 5.4))
ax.plot_frames(duration * 1e3, p_excited, slider_values=detuning,
              slider_label="detuning (MHz)", color="#1f77b4",
              label="P(excited)")
ax.set_ylim(0.0, 1.02)
ax.set_xlim(0.0, 500.0)
ax.set_xlabel("pulse duration (ns)")
ax.set_ylabel("P(excited)")
ax.set_title(f"Rabi oscillation vs detuning, {RABI_MHZ:.0f} MHz drive on resonance")
ax.legend(loc="upper right")
ax.grid(True)
fig.tight_layout()

gif_path = os.path.join(tempfile.gettempdir(), "plotpress_rabi_chevron_cuts.gif")
fig.save(gif_path, fps=8)
Total running time of the script: (0 minutes 7.175 seconds)