Note
Go to the end to download the full example code.
Flux-pulse rise-time optimization for a CZ gate
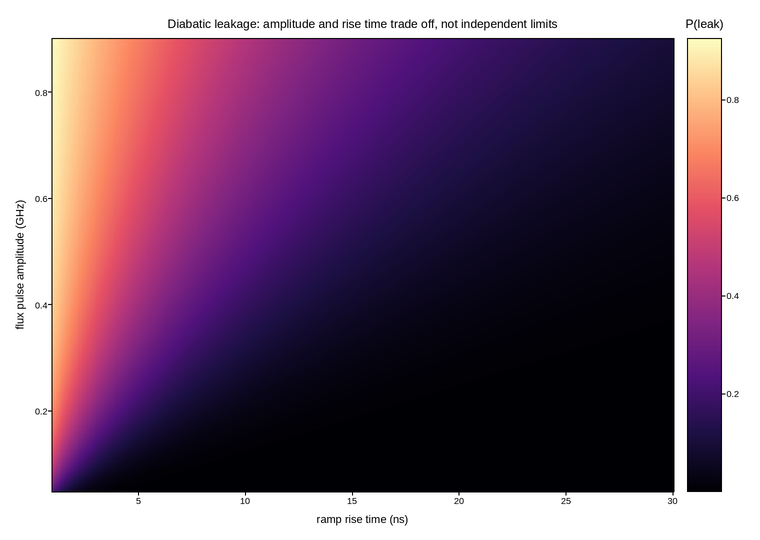
Diabatic leakage into |0,2> at the end of a flux pulse’s ramp, swept
over the ramp’s rise time and its target amplitude – the tune-up that
shapes a CZ flux pulse once the operating point itself
(CZ gate calibration: the 11-02 avoided crossing chevron) is already known. Landau-Zener
theory says the leakage left behind by sweeping through an avoided crossing
falls off exponentially in the sweep rate, amplitude divided by rise time
– so the same target amplitude leaks less the more slowly it is
approached, and a pulse reaching further past the crossing needs a
correspondingly longer ramp to stay just as adiabatic. The practical
consequence is a diagonal boundary, not a simple threshold: there is no
rise time that is safe at every amplitude, and no amplitude that is safe at
every rise time, only a trade-off between the two.
Live figure — pick a tool, then zoom, pan, point-pick or annotate. Nothing is active until a tool is selected.
View this figure’s Vega export ↗ — the raw JSON spec, rendered live by a real Vega engine.
View this figure’s Vega-Lite export ↗ — the raw JSON spec(s), rendered live by a real Vega-Lite engine.
import numpy as np
import polars as pl
import plotpress

RATE_STAR = 0.035               # GHz/ns, sets the Landau-Zener leakage scale

rise_time = np.linspace(1.0, 30.0, 320)       # ns
amplitude = np.linspace(0.05, 0.9, 300)        # GHz, detuning swept past the crossing
RISE, AMP = np.meshgrid(rise_time, amplitude)

rate = AMP / RISE                              # GHz / ns
leakage = np.exp(-2.0 * RATE_STAR / rate)

# One row per swept (rise time, amplitude) point -- sorted before the
# reshape below so the pivot back to a grid is correct regardless of order.
sweep = pl.DataFrame({
    "rise_time_ns": RISE.ravel(),
    "amplitude_ghz": AMP.ravel(),
    "leakage": leakage.ravel(),
}).sort(["amplitude_ghz", "rise_time_ns"])

rise_axis = sweep["rise_time_ns"].unique().sort().to_numpy()
amplitude_axis = sweep["amplitude_ghz"].unique().sort().to_numpy()
leakage = sweep["leakage"].to_numpy().reshape(amplitude_axis.size, rise_axis.size)

fig, ax = plotpress.subplots(figsize=(7.6, 5.4))
mesh = ax.pcolormesh(rise_axis, amplitude_axis, leakage, cmap="magma")
bar = fig.colorbar(mesh, ax=ax)
bar.set_title("P(leak)")
ax.set_xlabel("ramp rise time (ns)")
ax.set_ylabel("flux pulse amplitude (GHz)")
ax.set_title("Diabatic leakage: amplitude and rise time trade off, not independent limits")
fig.tight_layout()
Total running time of the script: (0 minutes 0.229 seconds)