Note
Go to the end to download the full example code.
Flux-line crosstalk calibration
Qubit frequency (from two-tone spectroscopy) swept over its own flux-bias voltage and a neighboring qubit’s flux-bias voltage, on a device where every flux line couples a little to every SQUID loop, not just its own. If the two lines were perfectly independent, the qubit’s frequency arches would run dead vertical – constant in the neighbor’s voltage. The actual flux each SQUID loop sees is a linear combination of every line’s voltage, so the arches tilt: the neighbor’s voltage has to move by a specific ratio to the qubit’s own line to leave the loop’s total flux, and so the frequency, unchanged. That ratio – read directly off the tilt of the constant-frequency contours – is exactly the crosstalk coefficient a multi-qubit device’s control software has to compensate before any of its flux lines can be swept independently.
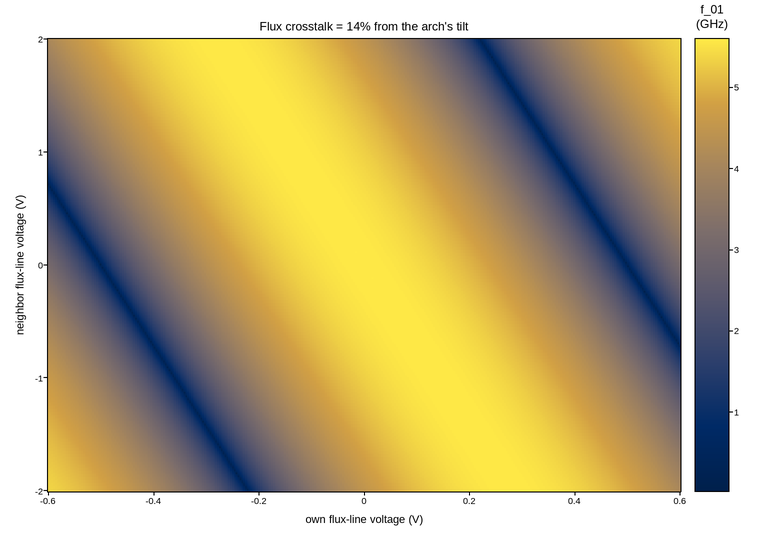
Live figure — pick a tool, then zoom, pan, point-pick or annotate. Nothing is active until a tool is selected.
View this figure’s Vega export ↗ — the raw JSON spec, rendered live by a real Vega engine.
View this figure’s Vega-Lite export ↗ — the raw JSON spec(s), rendered live by a real Vega-Lite engine.
import numpy as np
import polars as pl
import plotpress

F_MAX = 5.6                   # GHz
V_PERIOD = 1.0                  # own-line volts per flux quantum
XTALK = 0.14                    # neighbor-line coupling, in units of own-line volts

own_voltage = np.linspace(-0.6, 0.6, 340)
neighbor_voltage = np.linspace(-2.0, 2.0, 300)
V_OWN, V_NBR = np.meshgrid(own_voltage, neighbor_voltage)

phi = (V_OWN + XTALK * V_NBR) / V_PERIOD
frequency = F_MAX * np.sqrt(np.abs(np.cos(np.pi * phi)))

# One row per swept (own voltage, neighbor voltage) point -- sorted before
# the reshape below so the pivot back to a grid is correct regardless of
# row order.
sweep = pl.DataFrame({
    "own_voltage_v": V_OWN.ravel(),
    "neighbor_voltage_v": V_NBR.ravel(),
    "frequency_ghz": frequency.ravel(),
}).sort(["neighbor_voltage_v", "own_voltage_v"])

own_axis = sweep["own_voltage_v"].unique().sort().to_numpy()
neighbor_axis = sweep["neighbor_voltage_v"].unique().sort().to_numpy()
frequency = sweep["frequency_ghz"].to_numpy().reshape(neighbor_axis.size, own_axis.size)

fig, ax = plotpress.subplots(figsize=(7.6, 5.4))
mesh = ax.pcolormesh(own_axis, neighbor_axis, frequency, cmap="cividis")
bar = fig.colorbar(mesh, ax=ax)
bar.set_title("f_01\n(GHz)")
ax.set_xlabel("own flux-line voltage (V)")
ax.set_ylabel("neighbor flux-line voltage (V)")
ax.set_title(f"Flux crosstalk = {XTALK * 100:.0f}% from the arch's tilt")
fig.tight_layout()
Total running time of the script: (0 minutes 0.316 seconds)