Note
Go to the end to download the full example code.
Static ZZ crosstalk vs tunable-coupler flux and qubit detuning
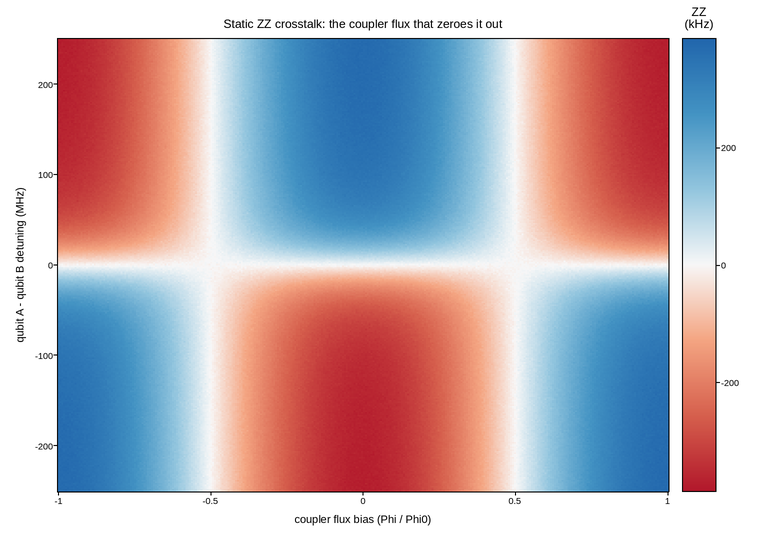
The always-on ZZ interaction between two capacitively coupled transmons,
mediated by a tunable coupler, swept over the coupler’s own flux bias and the
detuning between the two qubits. Two virtual exchange paths – through the
coupler’s own higher levels, and through direct capacitive coupling – have
opposite sign, so tuning the coupler’s frequency through the point where they
cancel drives the static ZZ rate through zero without touching either
qubit’s own frequency. That cancellation is what idle two-qubit pairs need,
since a nonzero always-on ZZ dephases every idling neighbor whether a
gate is being applied to them or not.
The rate is genuinely signed – it is a shift of one qubit’s frequency conditioned on the other’s state, positive or negative depending on which exchange path dominates – so, as with the driven cross-resonance rate in Cross-resonance ZX interaction rate map, a diverging colormap centered on zero is the only choice that puts the operating point the measurement exists to find at a fixed, recognizable color.
Live figure — pick a tool, then zoom, pan, point-pick or annotate. Nothing is active until a tool is selected.
View this figure’s Vega export ↗ — the raw JSON spec, rendered live by a real Vega engine.
View this figure’s Vega-Lite export ↗ — the raw JSON spec(s), rendered live by a real Vega-Lite engine.
import numpy as np
import polars as pl
import plotpress

A_ZZ_KHZ = 380.0              # peak |ZZ| rate, kHz
GAMMA_MHZ = 45.0               # detuning scale of the dispersive term
rng = np.random.default_rng(515)

coupler_flux = np.linspace(-1.0, 1.0, 320)     # Phi / Phi0
detuning = np.linspace(-250.0, 250.0, 300)      # MHz, qubit A - qubit B
FLUX, DELTA = np.meshgrid(coupler_flux, detuning)

zz_khz = A_ZZ_KHZ * np.cos(np.pi * FLUX) * DELTA / np.hypot(DELTA, GAMMA_MHZ)
zz_khz += rng.normal(0.0, 4.0, zz_khz.shape)

# One row per swept (coupler flux, detuning) point -- sorted before the
# reshape below so the pivot back to a grid is correct regardless of order.
sweep = pl.DataFrame({
    "coupler_flux_phi0": FLUX.ravel(),
    "detuning_mhz": DELTA.ravel(),
    "zz_khz": zz_khz.ravel(),
}).sort(["detuning_mhz", "coupler_flux_phi0"])

flux_axis = sweep["coupler_flux_phi0"].unique().sort().to_numpy()
detuning_axis = sweep["detuning_mhz"].unique().sort().to_numpy()
zz_khz = sweep["zz_khz"].to_numpy().reshape(detuning_axis.size, flux_axis.size)
lim = float(sweep["zz_khz"].abs().max())

fig, ax = plotpress.subplots(figsize=(7.6, 5.4))
mesh = ax.pcolormesh(flux_axis, detuning_axis, zz_khz, cmap="RdBu", vmin=-lim, vmax=lim)
bar = fig.colorbar(mesh, ax=ax)
bar.set_title("ZZ\n(kHz)")
ax.set_xlabel("coupler flux bias (Phi / Phi0)")
ax.set_ylabel("qubit A - qubit B detuning (MHz)")
ax.set_title("Static ZZ crosstalk: the coupler flux that zeroes it out")
fig.tight_layout()
Total running time of the script: (0 minutes 0.337 seconds)