Note
Go to the end to download the full example code.
Cross-resonance ZX interaction rate map
The two-qubit interaction rate a cross-resonance drive generates – driving the control qubit at the target’s frequency – swept over drive amplitude and control-target detuning. To leading order in perturbation theory the induced ZX rate is
zeta_ZX ~ J * Omega / delta,
proportional to the direct qubit-qubit coupling J and the drive amplitude
Omega, and inversely proportional to the detuning delta between the
two qubits – which is also why it changes sign across delta = 0:
which qubit sits higher in frequency decides which way the interaction
rotates the target. That sign is the entire reason a diverging colormap
belongs here rather than a sequential one – the physically meaningful
reference point is zeta_ZX = 0, not the map’s minimum, and a diverging
map is the only choice that puts it at a fixed, recognizable color instead of
wherever the data’s extremes happen to place it.
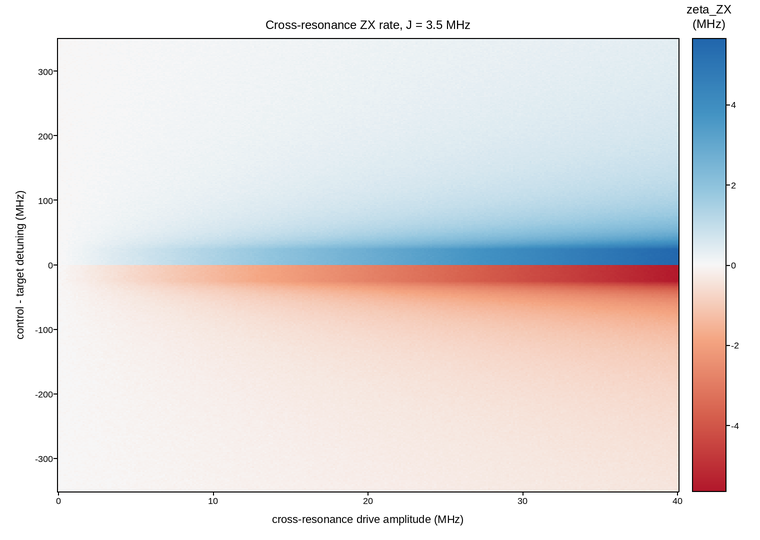
Live figure — pick a tool, then zoom, pan, point-pick or annotate. Nothing is active until a tool is selected.
View this figure’s Vega export ↗ — the raw JSON spec, rendered live by a real Vega engine.
View this figure’s Vega-Lite export ↗ — the raw JSON spec(s), rendered live by a real Vega-Lite engine.
import numpy as np
import polars as pl
import plotpress

J_MHZ = 3.5                  # direct qubit-qubit coupling, MHz
DETUNING_FLOOR_MHZ = 25.0    # closest approach to delta=0 this device operates at
rng = np.random.default_rng(212)

amplitude = np.linspace(0.0, 40.0, 300)      # drive amplitude, MHz (Rabi units)
detuning = np.linspace(-350.0, 350.0, 340)   # control - target, MHz
OMEGA, DELTA = np.meshgrid(amplitude, detuning)

delta_eff = np.sign(DELTA) * np.maximum(np.abs(DELTA), DETUNING_FLOOR_MHZ)
zx_rate = J_MHZ * OMEGA / delta_eff          # MHz
zx_rate += rng.normal(0.0, 0.03, zx_rate.shape)

# One row per swept (amplitude, detuning) point -- sorted before the reshape
# below so the pivot back to a grid is correct regardless of row order.
sweep = pl.DataFrame({
    "amplitude_mhz": OMEGA.ravel(),
    "detuning_mhz": DELTA.ravel(),
    "zx_rate_mhz": zx_rate.ravel(),
}).sort(["detuning_mhz", "amplitude_mhz"])

amplitude_axis = sweep["amplitude_mhz"].unique().sort().to_numpy()
detuning_axis = sweep["detuning_mhz"].unique().sort().to_numpy()
zx_rate = sweep["zx_rate_mhz"].to_numpy().reshape(detuning_axis.size, amplitude_axis.size)
lim = float(sweep["zx_rate_mhz"].abs().max())

fig, ax = plotpress.subplots(figsize=(7.6, 5.4))
mesh = ax.pcolormesh(amplitude_axis, detuning_axis, zx_rate, cmap="RdBu", vmin=-lim, vmax=lim)
bar = fig.colorbar(mesh, ax=ax)
bar.set_title("zeta_ZX\n(MHz)")
ax.set_xlabel("cross-resonance drive amplitude (MHz)")
ax.set_ylabel("control - target detuning (MHz)")
ax.set_title(f"Cross-resonance ZX rate, J = {J_MHZ:.1f} MHz")
fig.tight_layout()
Total running time of the script: (0 minutes 0.339 seconds)