Note
Go to the end to download the full example code.
Ramsey chevron: frequency calibration from a fringe pattern
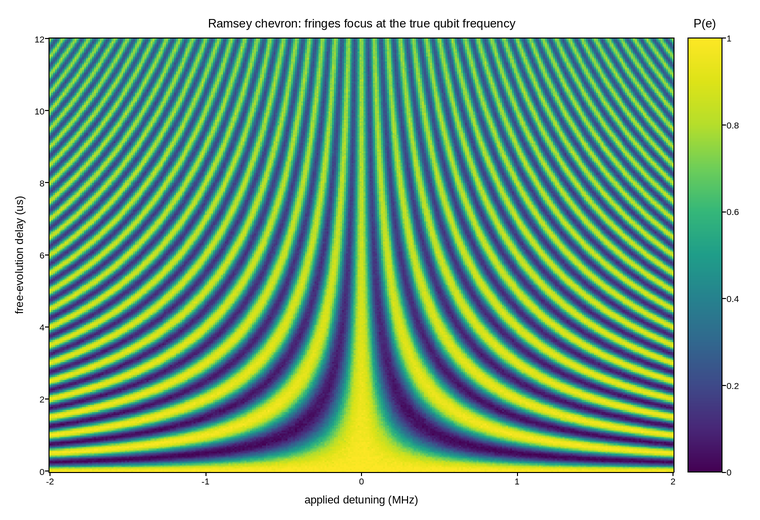
Excited-state population from a Ramsey sequence (pi/2 - wait tau - pi/2),
swept over both the free-evolution delay and an artificial detuning applied
in software between the two pulses. Every detuning traces its own oscillation
in delay, P_e = 1/2 + 1/2 exp(-tau/T2*) cos(2 pi delta tau), and the whole
family of them fans out from a single focus at delta = 0, where the two
pulses stay in phase at every delay. That focus is the calibration this
measurement is for: it marks the true qubit frequency far more precisely than
any single 1-D Ramsey trace, because a mis-set frequency shows up as the
whole chevron’s apex sliding sideways rather than as a subtle change in one
curve’s fitted period.
The population is bounded in [0, 1] with no meaningful midpoint of its
own – 0.5 is just “no information” from decay, not a physically special
value the color scale should center on – so a sequential map pinned to those
limits is the right choice, the same convention Qubit Rabi chevron
uses for its Rabi chevron.
Live figure — pick a tool, then zoom, pan, point-pick or annotate. Nothing is active until a tool is selected.
View this figure’s Vega export ↗ — the raw JSON spec, rendered live by a real Vega engine.
View this figure’s Vega-Lite export ↗ — the raw JSON spec(s), rendered live by a real Vega-Lite engine.
import numpy as np
import polars as pl
import plotpress

T2_STAR = 18.0             # microseconds
rng = np.random.default_rng(51)

detuning = np.linspace(-2.0, 2.0, 320)      # MHz, applied in software
delay = np.linspace(0.0, 12.0, 260)         # microseconds
D, TAU = np.meshgrid(detuning, delay)

p_excited = 0.5 + 0.5 * np.exp(-TAU / T2_STAR) * np.cos(2 * np.pi * D * TAU)
p_excited += rng.normal(0.0, 0.015, p_excited.shape)

# One row per swept (detuning, delay) shot -- sorted before the reshape
# below so the pivot back to a grid is correct regardless of row order.
sweep = pl.DataFrame({
    "detuning_mhz": D.ravel(),
    "delay_us": TAU.ravel(),
    "p_excited": p_excited.ravel(),
}).sort(["delay_us", "detuning_mhz"])

detuning_axis = sweep["detuning_mhz"].unique().sort().to_numpy()
delay_axis = sweep["delay_us"].unique().sort().to_numpy()
p_excited = sweep["p_excited"].to_numpy().reshape(delay_axis.size, detuning_axis.size)

fig, ax = plotpress.subplots(figsize=(7.6, 5.2))
mesh = ax.pcolormesh(detuning_axis, delay_axis, p_excited, cmap="viridis", vmin=0.0, vmax=1.0)
bar = fig.colorbar(mesh, ax=ax)
bar.set_title("P(e)")
ax.set_xlabel("applied detuning (MHz)")
ax.set_ylabel("free-evolution delay (us)")
ax.set_title("Ramsey chevron: fringes focus at the true qubit frequency")
fig.tight_layout()
Total running time of the script: (0 minutes 0.324 seconds)