Note
Go to the end to download the full example code.
Repetition code: a space-time syndrome plot
A distance-5 bit-flip repetition code: five data qubits in a line, four ancilla qubits each parity-checking one adjacent pair, run for many rounds of syndrome extraction. This is a simulated run, not a closed-form model – random bit-flip errors are injected on the data qubits each round, and the parity of every adjacent pair is recorded exactly the way a real device’s stabilizer measurements are, producing the same “space-time” picture decoders are built around.
The syndrome itself – the parity value each round – is not what gets decoded. Its change from the previous round does, because a stable parity means nothing new happened where that ancilla is looking. A single bit flip on an interior data qubit therefore shows up as exactly two simultaneous detection events, one on each ancilla that borders it, in the one round the flip occurred; a flip on an end qubit, bordered by only one ancilla, shows up as one. That pairing rule is the geometric fact minimum-weight perfect matching decoders are built on, and it is visible directly in the sparse pattern below without needing a decoder to point it out.
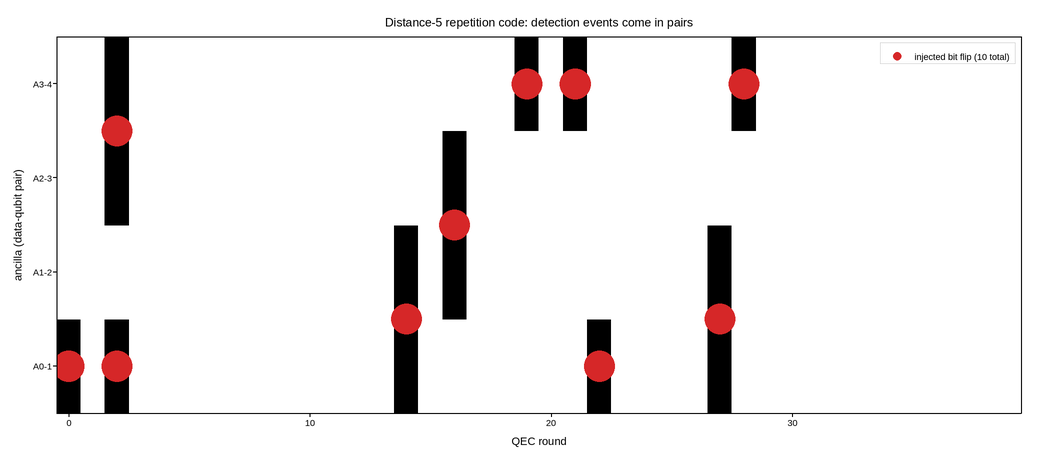
Live figure — pick a tool, then zoom, pan, point-pick or annotate. Nothing is active until a tool is selected.
View this figure’s Vega export ↗ — the raw JSON spec, rendered live by a real Vega engine.
View this figure’s Vega-Lite export ↗ — the raw JSON spec(s), rendered live by a real Vega-Lite engine.
import numpy as np
import polars as pl
import plotpress

rng = np.random.default_rng(2027)

N_DATA = 5
N_ANCILLA = N_DATA - 1
N_ROUNDS = 40
P_ERROR = 0.035                                     # bit-flip probability per qubit per round

data = np.zeros(N_DATA, dtype=int)
prev_syndrome = np.zeros(N_ANCILLA, dtype=int)
detection_rows = []
error_rows = []

for t in range(N_ROUNDS):
    flips = rng.random(N_DATA) < P_ERROR
    if flips.any():
        for q in np.nonzero(flips)[0]:
            error_rows.append({"round": t, "data_qubit": int(q)})
    data = data ^ flips.astype(int)
    syndrome = data[:-1] ^ data[1:]
    detections = syndrome ^ prev_syndrome
    for a in range(N_ANCILLA):
        detection_rows.append({"round": t, "ancilla": a, "detected": int(detections[a])})
    prev_syndrome = syndrome

# One row per (round, ancilla) parity-check outcome -- the shape a real
# device's own syndrome-extraction log is in, before it is gridded for the
# space-time plot.
syndrome_log = pl.DataFrame(detection_rows).sort(["ancilla", "round"])
rounds_axis = syndrome_log["round"].unique().sort().to_numpy()
ancilla_axis = syndrome_log["ancilla"].unique().sort().to_numpy()
detected_grid = syndrome_log["detected"].to_numpy().reshape(ancilla_axis.size, rounds_axis.size)

errors = pl.DataFrame(error_rows) if error_rows else pl.DataFrame(
    {"round": [], "data_qubit": []})

def marker_row(data_qubit):
    """Average of the ancilla rows a data qubit borders, clipped to the axis."""
    return float(np.clip(data_qubit - 0.5, 0.0, N_ANCILLA - 1))


fig, ax = plotpress.subplots(figsize=(10.4, 4.6))
ax.pcolormesh(rounds_axis, ancilla_axis, detected_grid, cmap="gray_r", vmin=0.0, vmax=1.0)

for row in errors.iter_rows(named=True):
    ax.scatter([row["round"]], [marker_row(row["data_qubit"])], s=22.0, color="#d62728")
n_error_events = errors.height
ax.scatter([], [], s=22.0, color="#d62728", label=f"injected bit flip ({n_error_events} total)")

ax.set_yticks(ancilla_axis, [f"A{a}-{a+1}" for a in ancilla_axis])
ax.set_xlabel("QEC round")
ax.set_ylabel("ancilla (data-qubit pair)")
ax.set_title(f"Distance-{N_DATA} repetition code: detection events come in pairs")
ax.legend(loc="upper right")
fig.tight_layout()
Total running time of the script: (0 minutes 0.109 seconds)