Note
Go to the end to download the full example code.
Quantum process tomography: the Pauli transfer matrix of a noisy gate
Quantum process tomography characterizes a gate the same way a confusion
matrix characterizes a classifier: send in every basis state, see what comes
out. The Pauli transfer matrix does this in the Pauli basis rather than the
computational one, R_ij = (1/2) Tr[sigma_i Lambda(sigma_j)], because a
unitary gate’s PTM is then a clean signed permutation matrix – an ideal X
gate leaves I and X alone and flips the sign of Y and Z – and
any departure from that pattern is visible as a number that should be zero
but is not.
That departure is computed here, not assumed: amplitude damping and dephasing are applied as explicit Kraus maps to the ideal gate’s output, and the resulting channel is projected onto the Pauli basis directly with NumPy linear algebra, the same computation a tomography analysis pipeline performs on measured expectation values. Off-diagonal leakage in the reconstructed matrix is decoherence made visible: a diagonal entry shrunk below 1 means the corresponding Pauli component decayed, and a genuinely off-diagonal entry means one Pauli operator got rotated into another during the gate.
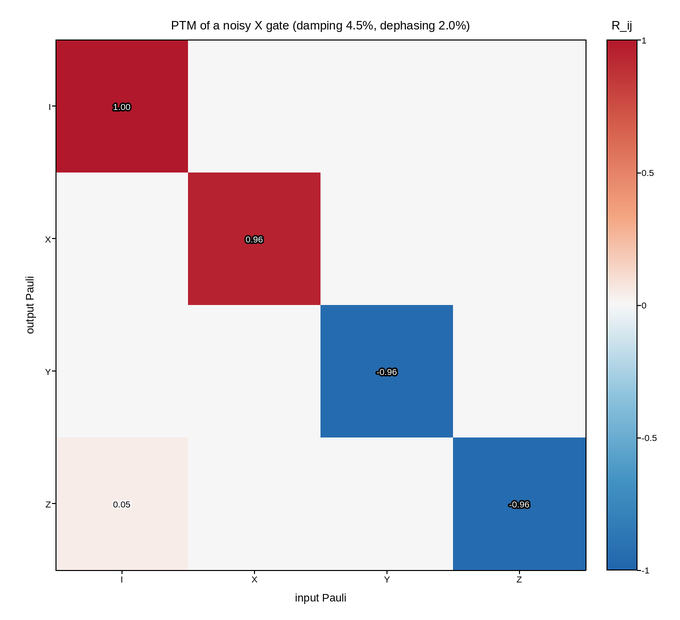
Live figure — pick a tool, then zoom, pan, point-pick or annotate. Nothing is active until a tool is selected.
View this figure’s Vega export ↗ — the raw JSON spec, rendered live by a real Vega engine.
View this figure’s Vega-Lite export ↗ — the raw JSON spec(s), rendered live by a real Vega-Lite engine.
import numpy as np
import polars as pl
import plotpress

GAMMA = 0.045                                       # amplitude damping probability
P_DEPHASE = 0.02                                    # additional dephasing probability

I2 = np.eye(2, dtype=complex)
X = np.array([[0, 1], [1, 0]], dtype=complex)
Y = np.array([[0, -1j], [1j, 0]], dtype=complex)
Z = np.array([[1, 0], [0, -1]], dtype=complex)
PAULIS = {"I": I2, "X": X, "Y": Y, "Z": Z}
LABELS = ["I", "X", "Y", "Z"]

TARGET = X                                          # the gate under test: a bit flip

# Kraus operators for amplitude damping and dephasing applied after the ideal
# unitary -- gate-time relaxation and dephasing, the two channels every real
# single-qubit gate picks up.
K0_AD = np.array([[1.0, 0.0], [0.0, np.sqrt(1.0 - GAMMA)]], dtype=complex)
K1_AD = np.array([[0.0, np.sqrt(GAMMA)], [0.0, 0.0]], dtype=complex)
K0_PD = np.sqrt(1.0 - P_DEPHASE / 2.0) * I2
K1_PD = np.sqrt(P_DEPHASE / 2.0) * Z
KRAUS = [K_ad @ K_pd for K_ad in (K0_AD, K1_AD) for K_pd in (K0_PD, K1_PD)]


def apply_channel(op):
    """Ideal gate, then amplitude damping and dephasing, as linear maps on op."""
    gated = TARGET @ op @ TARGET.conj().T
    return sum(K @ gated @ K.conj().T for K in KRAUS)


ptm = np.zeros((4, 4))
for j, pj in enumerate(LABELS):
    output = apply_channel(PAULIS[pj])
    for i, pi in enumerate(LABELS):
        ptm[i, j] = 0.5 * np.real(np.trace(PAULIS[pi] @ output))

ideal_ptm = np.zeros((4, 4))
for j, pj in enumerate(LABELS):
    ideal_output = TARGET @ PAULIS[pj] @ TARGET.conj().T
    for i, pi in enumerate(LABELS):
        ideal_ptm[i, j] = 0.5 * np.real(np.trace(PAULIS[pi] @ ideal_output))

# One row per (input Pauli, output Pauli) matrix element -- the shape a
# process-tomography analysis pipeline's own reconstructed matrix is in,
# before it is drawn as a heatmap.
IN_IDX, OUT_IDX = np.meshgrid(np.arange(4), np.arange(4), indexing="ij")
elements = pl.DataFrame({
    "in_idx": IN_IDX.ravel(), "out_idx": OUT_IDX.ravel(),
    "measured": ptm.T.ravel(), "ideal": ideal_ptm.T.ravel(),
}).sort(["in_idx", "out_idx"])
ptm = elements["measured"].to_numpy().reshape(4, 4).T

fig, ax = plotpress.subplots(figsize=(6.8, 6.2))
im = ax.imshow(ptm, cmap="RdBu_r", vmin=-1.0, vmax=1.0, origin="upper",
               extent=(-0.5, 3.5, 3.5, -0.5))
bar = fig.colorbar(im, ax=ax)
bar.set_title("R_ij")

for row in elements.iter_rows(named=True):
    on_ideal_diag = abs(row["ideal"]) > 0.5
    leaked = abs(row["measured"] - row["ideal"]) > 0.03
    if not on_ideal_diag and not leaked:
        continue
    ax.text(row["in_idx"], row["out_idx"], f"{row['measured']:.2f}", ha="center",
            va="center", fontsize=9,
            color="#000000" if abs(row["measured"]) < 0.55 else "#ffffff")

ax.set_xticks(np.arange(4), LABELS)
ax.set_yticks(np.arange(4), LABELS)
ax.set_aspect("equal")
ax.set_xlabel("input Pauli")
ax.set_ylabel("output Pauli")
ax.set_title(f"PTM of a noisy X gate (damping {GAMMA:.1%}, dephasing {P_DEPHASE:.1%})")
fig.tight_layout()
Total running time of the script: (0 minutes 0.122 seconds)