Note
Go to the end to download the full example code.
GHZ parity oscillation: N-fold fringes and their fading visibility
The standard way to verify genuine N-qubit entanglement without measuring the
full density matrix. After preparing the GHZ state
(|00...0> + |11...1>) / sqrt(2), a global analysis rotation of angle
phi is applied to every qubit before measuring the parity
<prod sigma_z>. For a product state the parity would not depend on
phi at all; for an N-qubit GHZ state it oscillates N times faster
than a single qubit’s Ramsey fringe, cos(N phi) – entanglement literally
multiplies the interferometer’s fringe frequency, which is why this is the
diagnostic of choice rather than a slower full tomography.
The oscillation frequency is not the part that degrades. What decays with N is the visibility: an N-qubit GHZ state is only as coherent as its weakest link, and dephasing on any one of the N qubits scrambles the global phase the same way one bad mirror ruins a multi-pass interferometer. The visibility plotted here falls off with N accordingly, and the qubit count at which the fringes disappear into the shot-noise floor is the practical certification limit of the device – a number this figure produces directly rather than one that has to be inferred from a fit.
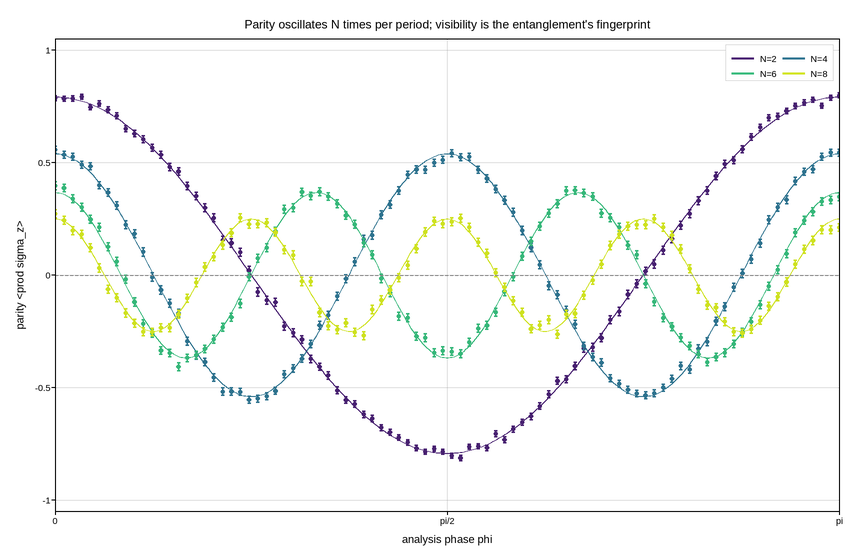
Live figure — pick a tool, then zoom, pan, point-pick or annotate. Nothing is active until a tool is selected.
View this figure’s Vega export ↗ — the raw JSON spec, rendered live by a real Vega engine.
View this figure’s Vega-Lite export ↗ — the raw JSON spec(s), rendered live by a real Vega-Lite engine.
import numpy as np
import polars as pl
import plotpress

rng = np.random.default_rng(2411)

N_QUBITS = [2, 4, 6, 8]
V0 = 0.96                                          # single-qubit-limited visibility
N_DECAY = 5.2                                       # qubits over which visibility 1/e-folds
SHOTS = 3000

phi = np.linspace(0.0, np.pi, 90)                   # analysis phase, one period for N=1

runs = []
for n in N_QUBITS:
    visibility = V0 * np.exp(-(n - 1) / N_DECAY)
    parity = visibility * np.cos(n * phi)
    sigma = np.sqrt(np.clip(1.0 - parity ** 2, 0.0, 1.0) / SHOTS)
    parity_meas = np.clip(parity + rng.normal(0.0, sigma), -1.0, 1.0)
    runs.append(pl.DataFrame({
        "n_qubits": n, "phi": phi, "parity": parity_meas, "sigma": sigma,
        "visibility": visibility,
    }))

# One row per (qubit count, analysis phase) measurement -- the shape a
# parity-oscillation calibration sweep is actually logged in, before one
# curve per qubit count is picked out of it.
sweep = pl.concat(runs)

lut = plotpress.get_cmap("viridis")
colors = ["#%02x%02x%02x" % tuple(lut[i])
          for i in np.linspace(20, 220, len(N_QUBITS)).astype(int)]

fig, ax = plotpress.subplots(figsize=(8.6, 5.6))

for n, color in zip(N_QUBITS, colors):
    run = sweep.filter(pl.col("n_qubits") == n)
    phi_run = run["phi"].to_numpy()
    ax.errorbar(phi_run, run["parity"].to_numpy(), yerr=run["sigma"].to_numpy(),
                color=color, marker="o", markersize=3.0, linestyle="none",
                capsize=1.5, alpha=0.85, label=f"N={n}")
    v = float(run["visibility"][0])
    fine = np.linspace(0.0, np.pi, 400)
    ax.plot(fine, v * np.cos(n * fine), color=color, linewidth=1.2)

ax.axhline(0.0, color="#888888", linewidth=0.9)
ax.set_xlim(0.0, np.pi)
ax.set_ylim(-1.05, 1.05)
ax.set_xticks([0.0, np.pi / 2, np.pi], ["0", "pi/2", "pi"])
ax.set_xlabel("analysis phase phi")
ax.set_ylabel("parity <prod sigma_z>")
ax.set_title("Parity oscillates N times per period; visibility is the entanglement's fingerprint")
ax.legend(loc="upper right", ncol=2)
ax.grid(True)
fig.tight_layout()
Total running time of the script: (0 minutes 0.142 seconds)