Note
Go to the end to download the full example code.
Leakage RB: population escaping the computational subspace
Standard RB survival probability alongside the population measured
outside the computational subspace altogether – leaked into the
transmon’s second excited state – both against sequence length. An
ordinary RB sequence only ever asks “did this qubit end up where a perfect
sequence would have left it,” so any population that leaked to |2>
partway through and never came back reads as an ordinary error,
indistinguishable from a stochastic bit flip. Leakage RB adds the extra
readout that distinguishes the two: leaked population grows monotonically
and saturates, since |2> is nearly a trap once reached, while ordinary
population continues decaying toward its random-circuit floor. Seeing the
leakage curve saturate well before the survival curve reaches its own
floor is what tells a calibration engineer to revisit
DRAG coefficient calibration from amplified leakage rather than just accept the survival
curve’s fitted error rate at face value.
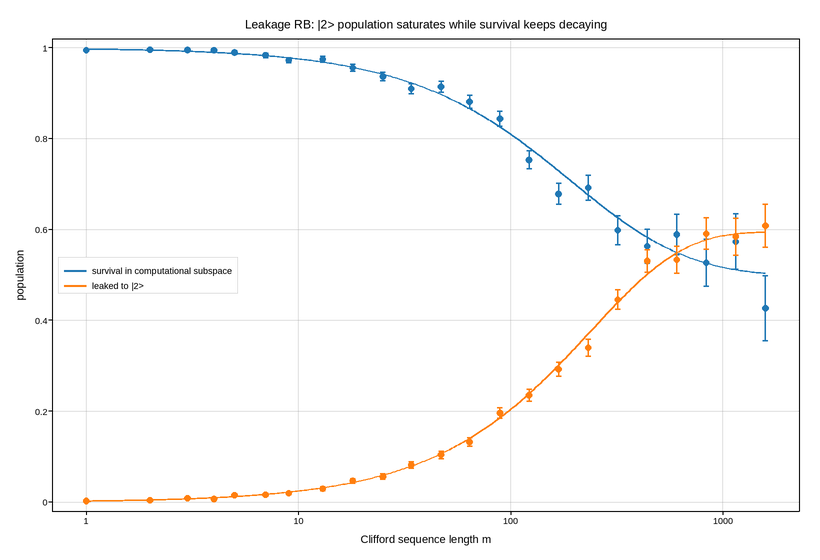
Live figure — pick a tool, then zoom, pan, point-pick or annotate. Nothing is active until a tool is selected.
View this figure’s Vega export ↗ — the raw JSON spec, rendered live by a real Vega engine.
View this figure’s Vega-Lite export ↗ — the raw JSON spec(s), rendered live by a real Vega-Lite engine.
import numpy as np
import polars as pl
import plotpress

ASYMPTOTE = 0.5
P_SURVIVAL = 0.9975              # per-gate depolarizing parameter (computational subspace)
LEAK_PER_GATE = 0.0025            # per-gate leakage rate into |2>
SEEP_PER_GATE = 0.0017            # per-gate seepage rate back from |2>
rng = np.random.default_rng(1809)

lengths = np.unique(np.round(np.logspace(0, 3.2, 24)).astype(int))

leak_asymptote = LEAK_PER_GATE / (LEAK_PER_GATE + SEEP_PER_GATE)
leak_rate = LEAK_PER_GATE + SEEP_PER_GATE
p_leak = leak_asymptote * (1.0 - np.exp(-leak_rate * lengths))

survival = ASYMPTOTE + (1.0 - ASYMPTOTE) * (1.0 - p_leak) * P_SURVIVAL ** lengths

err = 0.012 * np.sqrt(lengths / lengths[0])
survival_meas = np.clip(survival + rng.normal(0.0, err * 0.15), 0.0, 1.0)
leak_meas = np.clip(p_leak + rng.normal(0.0, err * 0.1), 0.0, 1.0)

# One row per (sequence length, curve) measurement -- the shape the two
# readouts (in-subspace survival and leaked population) are actually
# logged in, before either is plotted.
runs = pl.concat([
    pl.DataFrame({"sequence_length": lengths, "curve": "survival",
                  "value": survival_meas, "error": err * 0.15}),
    pl.DataFrame({"sequence_length": lengths, "curve": "leaked",
                  "value": leak_meas, "error": err * 0.1}),
])

survival_run = runs.filter(pl.col("curve") == "survival")
leaked_run = runs.filter(pl.col("curve") == "leaked")

fig, ax = plotpress.subplots(figsize=(8.2, 5.6))
ax.errorbar(survival_run["sequence_length"].to_numpy(),
            survival_run["value"].to_numpy(),
            yerr=survival_run["error"].to_numpy(), color="#1f77b4",
            marker="o", markersize=4.5, linestyle="none", capsize=2.5,
            label="survival in computational subspace")
ax.errorbar(leaked_run["sequence_length"].to_numpy(),
            leaked_run["value"].to_numpy(),
            yerr=leaked_run["error"].to_numpy(), color="#ff7f0e",
            marker="o", markersize=4.5, linestyle="none", capsize=2.5,
            label="leaked to |2>")
fine = np.logspace(0, 3.2, 300)
fine_leak = leak_asymptote * (1.0 - np.exp(-leak_rate * fine))
ax.plot(fine, ASYMPTOTE + (1.0 - ASYMPTOTE) * (1.0 - fine_leak) * P_SURVIVAL ** fine,
        color="#1f77b4", linewidth=1.3)
ax.plot(fine, fine_leak, color="#ff7f0e", linewidth=1.3)

ax.set_xscale("log")
ax.set_ylim(-0.02, 1.02)
ax.set_xlabel("Clifford sequence length m")
ax.set_ylabel("population")
ax.set_title("Leakage RB: |2> population saturates while survival keeps decaying")
ax.legend(loc="center left")
ax.grid(True)
fig.tight_layout()
Total running time of the script: (0 minutes 0.126 seconds)