Note
Go to the end to download the full example code.
X-ray powder diffraction with indexed peaks
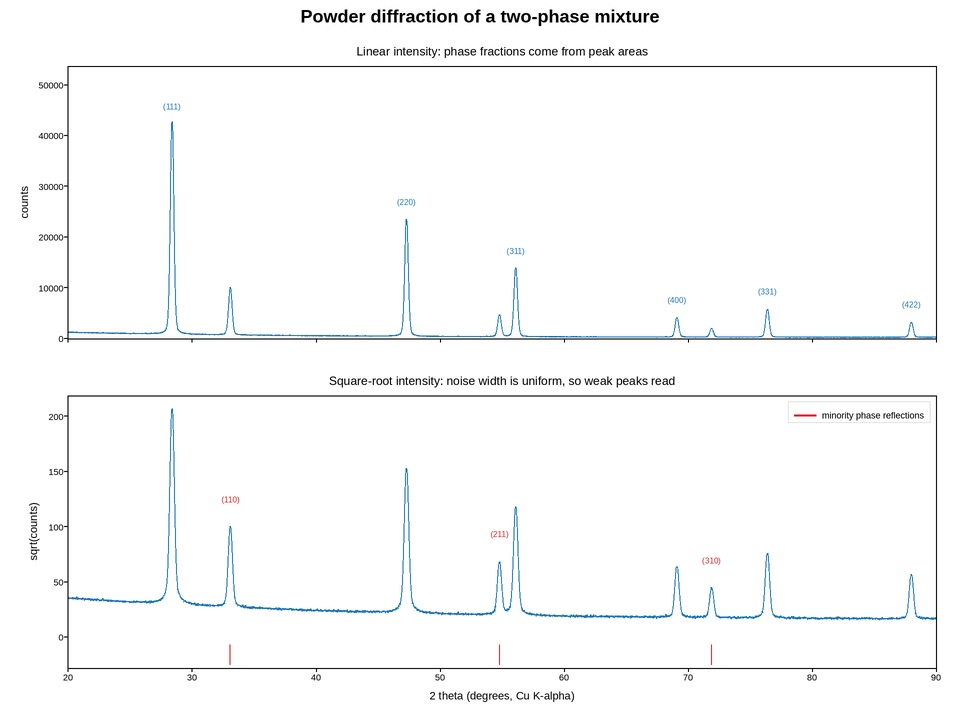
A powder pattern from a two-phase mixture: intensity against the scattering angle two-theta. Everything quantitative about the sample is in the positions and relative heights of the peaks, and both are easy to destroy with the wrong plotting choices.
Intensity spans three decades between the strongest reflection and the weak high-angle ones that pin down the lattice parameters, so the pattern is drawn twice: linear on the main axes, where the phase fractions are read from peak areas, and with a square-root intensity axis in the inset-like second panel, where the weak reflections become visible. Square root rather than log, because counting statistics make the noise proportional to the square root of the intensity – on that axis the background noise has uniform width, which is exactly what makes a genuine weak peak distinguishable from a fluctuation.
Peaks are labelled with their Miller indices rather than their angles, because
the indices are what identifies the phase; the angle is just where the
instrument happened to find it. Two phases are present, so the labels are
coloured by phase and the minority phase’s peaks are marked underneath with
eventplot, which keeps the tick marks out of the pattern itself.
Live figure — pick a tool, then zoom, pan, point-pick or annotate. Nothing is active until a tool is selected.
View this figure’s Vega export ↗ — the raw JSON spec, rendered live by a real Vega engine.
View this figure’s Vega-Lite export ↗ — the raw JSON spec(s), rendered live by a real Vega-Lite engine.
import numpy as np
import polars as pl
import plotpress

rng = np.random.default_rng(1912)

two_theta = np.linspace(20.0, 90.0, 3500)          # degrees

# Phase A (majority): a cubic phase. (angle, relative intensity, hkl)
PHASE_A = [(28.4, 1.00, "111"), (47.3, 0.55, "220"), (56.1, 0.32, "311"),
           (69.1, 0.09, "400"), (76.4, 0.13, "331"), (88.0, 0.07, "422")]
# Phase B (minority, ~12% by weight): a second cubic phase.
PHASE_B = [(33.1, 0.22, "110"), (54.8, 0.10, "211"), (71.9, 0.04, "310")]

PEAK_WIDTH = 0.13                                  # degrees, instrument + size
SCALE = 4.2e4                                      # counts at the strongest peak


def pattern(peaks, scale):
    out = np.zeros_like(two_theta)
    for centre, rel, _ in peaks:
        # Pseudo-Voigt: a Gaussian core with Lorentzian tails, as diffraction
        # peaks actually are -- a pure Gaussian underestimates the tails badly.
        d = (two_theta - centre) / PEAK_WIDTH
        out += scale * rel * (0.7 * np.exp(-0.5 * d ** 2) + 0.3 / (1.0 + d ** 2))
    return out


counts = pattern(PHASE_A, SCALE) + pattern(PHASE_B, SCALE)
counts += 260.0 + 900.0 * np.exp(-(two_theta - 22.0) / 18.0)     # amorphous hump
counts = rng.poisson(np.clip(counts, 0.0, None)).astype(float)   # counting noise

# One row per diffractometer step -- the shape a powder-diffraction scan is
# actually recorded in, before it is drawn on linear and square-root axes.
scan = pl.DataFrame({"two_theta": two_theta, "counts": counts})
two_theta = scan["two_theta"].to_numpy()
counts = scan["counts"].to_numpy()

fig, axes = plotpress.subplots(2, 1, figsize=(9.6, 7.2), sharex=True)
ax_lin, ax_sqrt = axes

ax_lin.plot(two_theta, counts, color="#1f77b4", linewidth=0.8)
for centre, rel, hkl in PHASE_A:
    ax_lin.annotate(f"({hkl})", xy=(centre, SCALE * rel),
                    xytext=(centre, SCALE * rel + 3200), ha="center",
                    color="#1f77b4", fontsize=8)
ax_lin.set_ylabel("counts")
ax_lin.set_ylim(0.0, SCALE * 1.28)
ax_lin.set_title("Linear intensity: phase fractions come from peak areas")

ax_sqrt.plot(two_theta, np.sqrt(counts), color="#1f77b4", linewidth=0.8)
for centre, rel, hkl in PHASE_B:
    ax_sqrt.annotate(f"({hkl})", xy=(centre, np.sqrt(SCALE * rel)),
                     xytext=(centre, np.sqrt(SCALE * rel) + 26), ha="center",
                     color="#d62728", fontsize=8)
ax_sqrt.eventplot([[c for c, _, _ in PHASE_B]], lineoffsets=[-16.0],
                  linelengths=18.0, color="#d62728",
                  label="minority phase reflections")
ax_sqrt.set_xlim(20.0, 90.0)
ax_sqrt.set_ylim(-28.0, None)
ax_sqrt.set_xlabel("2 theta (degrees, Cu K-alpha)")
ax_sqrt.set_ylabel("sqrt(counts)")
ax_sqrt.set_title("Square-root intensity: noise width is uniform, so weak peaks read")
ax_sqrt.legend(loc="upper right")

fig.suptitle("Powder diffraction of a two-phase mixture")
fig.tight_layout()
Total running time of the script: (0 minutes 0.313 seconds)