Note
Go to the end to download the full example code.
Raman hyperspectral line map
A Raman line scan across the edge of an exfoliated 2-D flake: a full spectrum is recorded at every position, so the raw data is intensity against Raman shift and position. Peak positions identify the material, and their ratios and widths report layer number and strain.
Raman is a weak effect sitting on a strong fluorescence background, and the
peaks span a wide intensity range – the graphene G and 2D bands here are two
orders above the silicon substrate line’s tail. PowerNorm with an exponent
below one lifts the weak bands into view without clipping the strong ones or
resorting to a log scale, which the near-zero background between peaks would
not survive.
The flake edge is a genuine discontinuity: the substrate peak appears and the carbon bands vanish within one step of the stage. Interpolating across it would invent a gradient where the physics has a step.
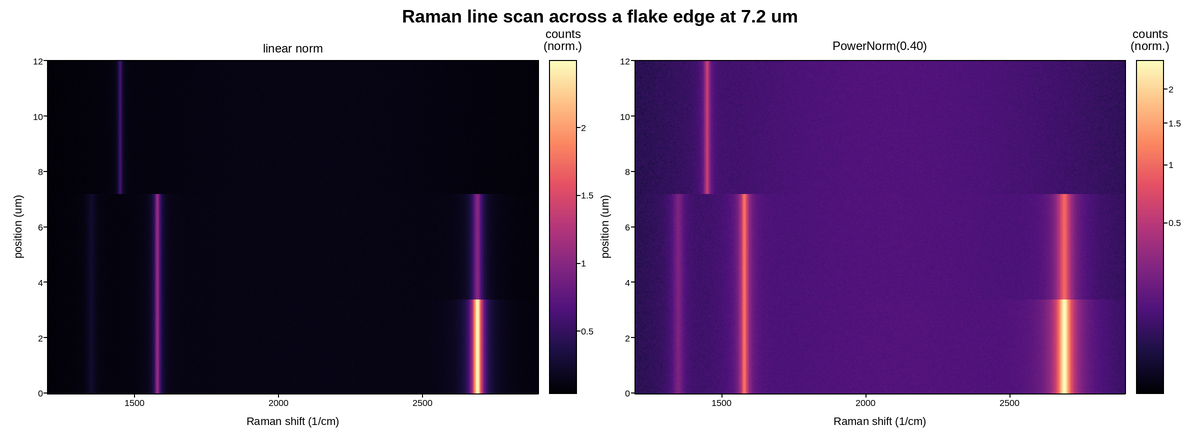
Live figure — pick a tool, then zoom, pan, point-pick or annotate. Nothing is active until a tool is selected.
View this figure’s Vega export ↗ — the raw JSON spec, rendered live by a real Vega engine.
View this figure’s Vega-Lite export ↗ — the raw JSON spec(s), rendered live by a real Vega-Lite engine.
import numpy as np
import polars as pl
import plotpress

rng = np.random.default_rng(67)
shift = np.linspace(1200.0, 2900.0, 420)     # cm^-1
position = np.linspace(0.0, 12.0, 300)       # micrometres
S, P = np.meshgrid(shift, position)

# The flake covers x < 7.2 um; bare substrate beyond it.
on_flake = P < 7.2
# Layer number steps up across the flake, changing the 2D/G ratio.
bilayer = (P > 3.4) & on_flake


def band(centre, width, amplitude):
    return amplitude * width ** 2 / ((S - centre) ** 2 + width ** 2)


intensity = 0.02 + 0.10 * np.exp(-((S - 2100.0) ** 2) / 9.0e5)   # fluorescence
intensity += band(1580.0, 9.0, np.where(on_flake, 1.0, 0.0))     # G band
intensity += band(1350.0, 14.0, np.where(on_flake, 0.16, 0.0))   # D (defects)
intensity += band(2690.0, 16.0, np.where(bilayer, 0.9, np.where(on_flake, 2.4, 0.0)))
intensity += band(1450.0, 6.0, np.where(on_flake, 0.0, 0.55))    # substrate line
intensity += rng.normal(0.0, 0.006, intensity.shape)
intensity = np.clip(intensity, 0.0, None)

# One row per spectrum sample -- the shape a Raman spectrometer's own line
# scan export is in, before it is gridded for the mesh.
scan = pl.DataFrame({"shift": S.ravel(), "position": P.ravel(), "intensity": intensity.ravel()}) \
    .sort(["position", "shift"])
shift = scan["shift"].unique().sort().to_numpy()
position = scan["position"].unique().sort().to_numpy()
intensity = scan["intensity"].to_numpy().reshape(position.size, shift.size)

fig, axes = plotpress.subplots(1, 2, figsize=(12.0, 4.4))
lin = axes[0].pcolormesh(shift, position, intensity, cmap="magma")
axes[0].set_title("linear norm")
fig.colorbar(lin, ax=axes[0]).set_title("counts\n(norm.)")

gamma = axes[1].pcolormesh(shift, position, intensity, cmap="magma",
                           norm=plotpress.PowerNorm(0.40))
axes[1].set_title("PowerNorm(0.40)")
fig.colorbar(gamma, ax=axes[1]).set_title("counts\n(norm.)")

for ax in axes:
    ax.set_xlabel("Raman shift (1/cm)")
    ax.set_ylabel("position (um)")
fig.suptitle("Raman line scan across a flake edge at 7.2 um")
fig.tight_layout()
Total running time of the script: (0 minutes 0.622 seconds)