Note
Go to the end to download the full example code.
EBSD grain orientation map
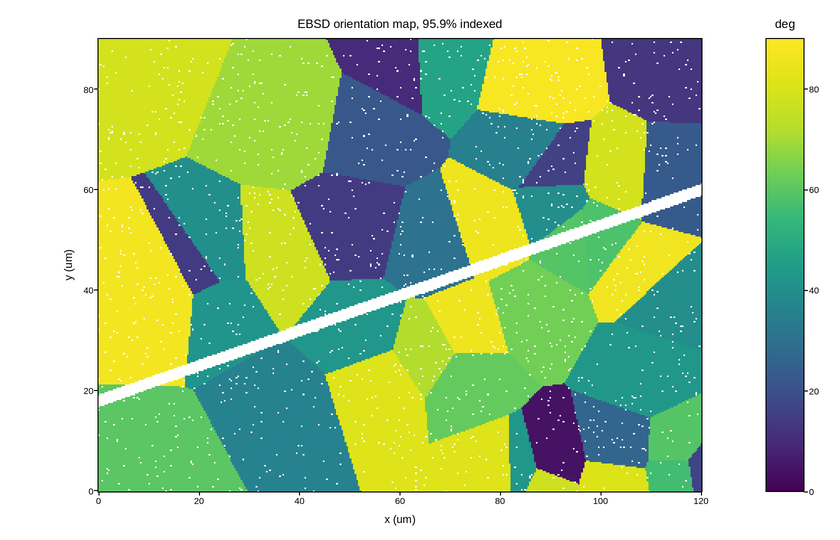
Electron backscatter diffraction indexes the crystal orientation at every point of a scan, so a polycrystalline sample resolves into grains: regions of nearly constant orientation separated by boundaries a pixel or two wide.
Like a charge stability diagram, this exercises the mesh renderer rather than a
colour scale. The field is piecewise constant with discontinuities at the grain
boundaries, and those boundaries are the measurement – grain size
distribution, texture and recrystallisation are all read from them. Any
smoothing between cells would blur exactly what the technique exists to
resolve; pcolormesh maps one data cell to one image cell, so the edges stay
sharp.
Points that failed to index – pits, contamination, the boundaries themselves
– are nan, which is how EBSD data genuinely arrives. The fraction indexed
is the standard scan-quality metric, so it goes in the title.
Live figure — pick a tool, then zoom, pan, point-pick or annotate. Nothing is active until a tool is selected.
View this figure’s Vega export ↗ — the raw JSON spec, rendered live by a real Vega engine.
View this figure’s Vega-Lite export ↗ — the raw JSON spec(s), rendered live by a real Vega-Lite engine.
import numpy as np
import polars as pl
import plotpress

rng = np.random.default_rng(47)
x = np.linspace(0.0, 120.0, 360)        # micrometres
y = np.linspace(0.0, 90.0, 300)
X, Y = np.meshgrid(x, y)

# A Voronoi tessellation, the standard idealisation of a grain structure.
N_GRAINS = 42
seeds = np.stack([rng.uniform(0.0, 120.0, N_GRAINS),
                  rng.uniform(0.0, 90.0, N_GRAINS)], axis=1)
orientation = rng.uniform(0.0, 90.0, N_GRAINS)   # degrees from the surface normal

d2 = (X[..., None] - seeds[:, 0]) ** 2 + (Y[..., None] - seeds[:, 1]) ** 2
grain_map = orientation[np.argmin(d2, axis=-1)]

# Unindexed points: a handling scratch, plus scattered low-confidence pixels.
grain_map[np.abs(Y - 0.35 * X - 18.0) < 1.2] = np.nan
grain_map[rng.random(grain_map.shape) < 0.015] = np.nan

# One row per scan point -- the shape an EBSD indexer's own point-by-point
# export is in, before it is gridded for the mesh.
scan = pl.DataFrame({"x": X.ravel(), "y": Y.ravel(), "orientation": grain_map.ravel()}) \
    .sort(["y", "x"])
x = scan["x"].unique().sort().to_numpy()
y = scan["y"].unique().sort().to_numpy()
grain_map = scan["orientation"].to_numpy().reshape(y.size, x.size)

indexed = 100.0 * np.isfinite(grain_map).mean()
fig, ax = plotpress.subplots(figsize=(8.4, 5.4))
mesh = ax.pcolormesh(x, y, grain_map, cmap="viridis", vmin=0.0, vmax=90.0)
fig.colorbar(mesh, ax=ax).set_title("deg")
ax.set_aspect("equal")
ax.set_xlabel("x (um)")
ax.set_ylabel("y (um)")
ax.set_title(f"EBSD orientation map, {indexed:.1f}% indexed")
fig.tight_layout()
Total running time of the script: (0 minutes 0.277 seconds)