Note
Go to the end to download the full example code.
Reciprocal space map (LogNorm)
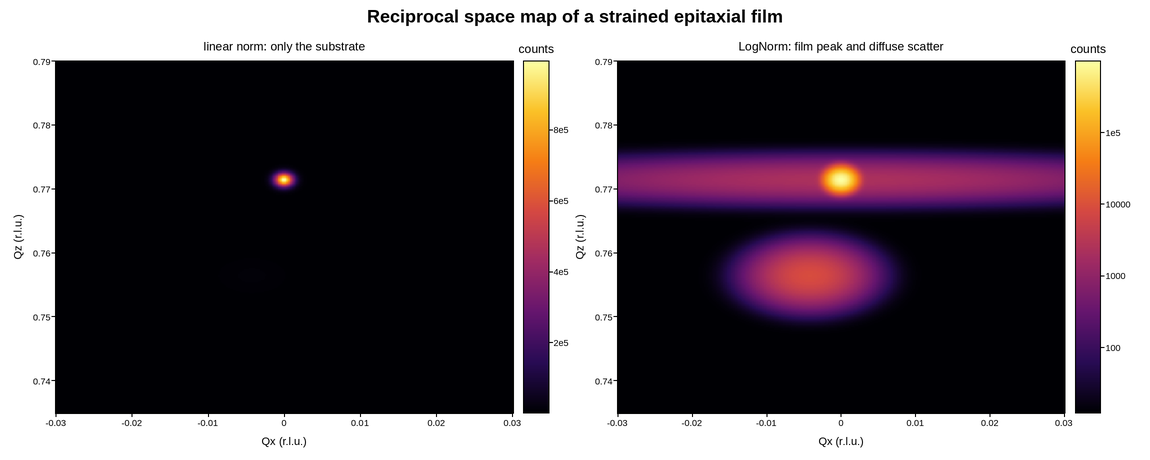
An X-ray reciprocal space map around an asymmetric Bragg reflection of an epitaxial film on a substrate – the measurement that separates lattice mismatch from tilt and tells you whether a layer grew strained or relaxed.
Two peaks sit in the map. The substrate reflection is narrow and intense; the film’s is broader, weaker, and offset. A fully strained film shares the substrate’s in-plane lattice parameter and sits directly below it in Qx; a relaxed one drifts toward the origin along the relaxation line.
Diffracted intensity spans five or six decades between a substrate peak and the
diffuse scatter around it, which is exactly where the interesting defect
signal lives. LogNorm is not a preference here – on a linear scale the
film peak is invisible next to the substrate.
Live figure — pick a tool, then zoom, pan, point-pick or annotate. Nothing is active until a tool is selected.
View this figure’s Vega export ↗ — the raw JSON spec, rendered live by a real Vega engine.
View this figure’s Vega-Lite export ↗ — the raw JSON spec(s), rendered live by a real Vega-Lite engine.
import numpy as np
import polars as pl
import plotpress

qx = np.linspace(-0.030, 0.030, 340)      # reciprocal lattice units
qz = np.linspace(0.735, 0.790, 320)
QX, QZ = np.meshgrid(qx, qz)


def peak(x0, z0, wx, wz, amp):
    return amp * np.exp(-((QX - x0) ** 2) / (2 * wx ** 2)
                        - ((QZ - z0) ** 2) / (2 * wz ** 2))


# Substrate: narrow and strong. Film: broader, weaker, partially relaxed.
intensity = peak(0.0, 0.7715, 0.00085, 0.00075, 1.0e6)
intensity += peak(-0.0042, 0.7565, 0.0034, 0.0021, 9.0e3)
# Diffuse scatter and the analyser streak through the substrate peak.
intensity += peak(0.0, 0.7715, 0.020, 0.0016, 2.2e3)
intensity += 12.0

# One row per detector pixel -- the shape an area detector's own frame
# export is in, before it is gridded for the mesh.
frame = pl.DataFrame({"qx": QX.ravel(), "qz": QZ.ravel(), "intensity": intensity.ravel()}) \
    .sort(["qz", "qx"])
qx = frame["qx"].unique().sort().to_numpy()
qz = frame["qz"].unique().sort().to_numpy()
intensity = frame["intensity"].to_numpy().reshape(qz.size, qx.size)

fig, axes = plotpress.subplots(1, 2, figsize=(11.5, 4.6))
lin = axes[0].pcolormesh(qx, qz, intensity, cmap="inferno")
axes[0].set_title("linear norm: only the substrate")
fig.colorbar(lin, ax=axes[0]).set_title("counts")

log = axes[1].pcolormesh(qx, qz, intensity, cmap="inferno",
                         norm=plotpress.LogNorm())
axes[1].set_title("LogNorm: film peak and diffuse scatter")
fig.colorbar(log, ax=axes[1]).set_title("counts")

for ax in axes:
    ax.set_xlabel("Qx (r.l.u.)")
    ax.set_ylabel("Qz (r.l.u.)")
fig.suptitle("Reciprocal space map of a strained epitaxial film")
fig.tight_layout()
Total running time of the script: (0 minutes 0.377 seconds)