Note
Go to the end to download the full example code.
PIV velocity field behind a cylinder
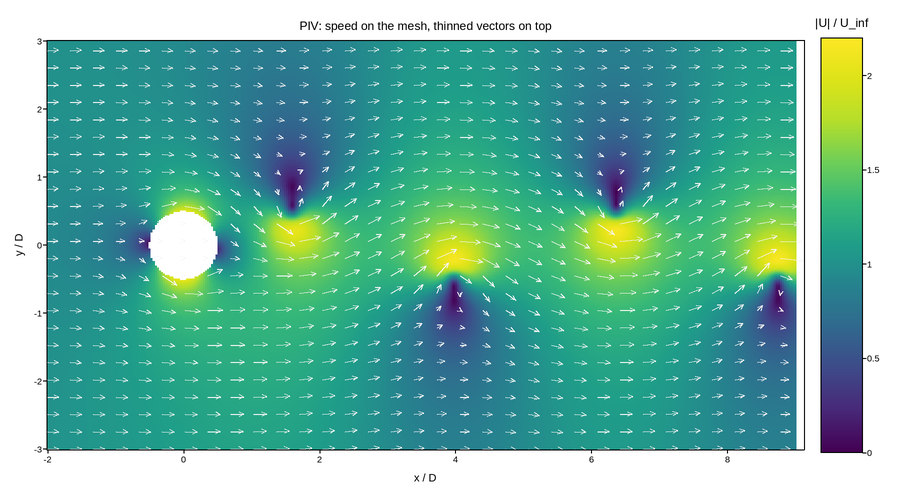
Particle image velocimetry of flow past a circular cylinder: cross-correlating successive images of seeded tracer particles gives a velocity vector per interrogation window, so the raw product is a vector field on a regular grid.
Speed goes on the mesh and the vectors go on top. Two decisions make that readable. The magnitude is a positive quantity with no meaningful midpoint, so it takes a sequential map – a diverging one would imply a reference speed that does not exist. And the vectors are thinned to roughly one arrow per ten windows: PIV grids are dense by construction, and drawing every vector hides the field it is supposed to annotate.
The cylinder itself is nan – there is no fluid there and so no measurement,
and leaving it unpainted is more honest than filling it with zero, which would
read as stagnant fluid.
Live figure — pick a tool, then zoom, pan, point-pick or annotate. Nothing is active until a tool is selected.
View this figure’s Vega export ↗ — the raw JSON spec, rendered live by a real Vega engine.
View this figure’s Vega-Lite export ↗ — the raw JSON spec(s), rendered live by a real Vega-Lite engine.
import numpy as np
import polars as pl
import plotpress

x = np.linspace(-2.0, 9.0, 360)          # cylinder diameters
y = np.linspace(-3.0, 3.0, 260)
X, Y = np.meshgrid(x, y)

U_INF = 1.0
RADIUS = 0.5

# Potential flow around the cylinder, plus a shed vortex street downstream.
r2 = X ** 2 + Y ** 2
u = U_INF * (1.0 - RADIUS ** 2 * (X ** 2 - Y ** 2) / r2 ** 2)
v = -U_INF * RADIUS ** 2 * (2.0 * X * Y) / r2 ** 2

STROUHAL = 0.21
for k, sign in enumerate([1, -1, 1, -1, 1, -1]):
    xc = 1.6 + k * (1.0 / STROUHAL) * 0.5
    yc = sign * 0.45
    d2 = (X - xc) ** 2 + (Y - yc) ** 2 + 0.06
    decay = np.exp(-((X - xc) ** 2) / 6.0)
    u += -sign * 0.55 * (Y - yc) / d2 * decay
    v += sign * 0.55 * (X - xc) / d2 * decay

u = np.where(r2 < RADIUS ** 2, np.nan, u)
v = np.where(r2 < RADIUS ** 2, np.nan, v)
speed = np.hypot(u, v)

# One row per interrogation window -- the shape a PIV cross-correlation pass
# actually outputs, before it is gridded for the mesh and quiver.
field = pl.DataFrame({
    "x": X.ravel(), "y": Y.ravel(),
    "u": u.ravel(), "v": v.ravel(), "speed": speed.ravel(),
}).sort(["y", "x"])
x = field["x"].unique().sort().to_numpy()
y = field["y"].unique().sort().to_numpy()
shape = (y.size, x.size)
u = field["u"].to_numpy().reshape(shape)
v = field["v"].to_numpy().reshape(shape)
speed = field["speed"].to_numpy().reshape(shape)
X, Y = np.meshgrid(x, y)

fig, ax = plotpress.subplots(figsize=(9.0, 5.0))
mesh = ax.pcolormesh(x, y, speed, cmap="viridis", vmin=0.0, vmax=2.2)
fig.colorbar(mesh, ax=ax).set_title("|U| / U_inf")

thin = (slice(None, None, 11), slice(None, None, 11))
ax.quiver(X[thin], Y[thin], np.nan_to_num(u[thin]), np.nan_to_num(v[thin]),
          color="#f5f5f5")

ax.set_aspect("equal")
ax.set_xlabel("x / D")
ax.set_ylabel("y / D")
ax.set_title("PIV: speed on the mesh, thinned vectors on top")
fig.tight_layout()
Total running time of the script: (0 minutes 0.325 seconds)