Note
Go to the end to download the full example code.
Annular flow on a curvilinear grid
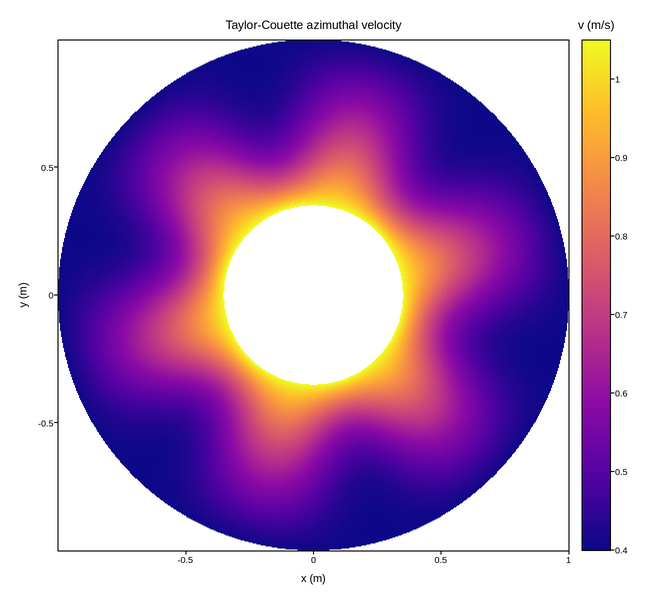
Taylor-Couette flow: the azimuthal velocity of a fluid between two concentric cylinders rotating at different rates, with a gentle six-fold modulation standing in for Taylor vortices.
The natural grid here is polar, so the cell corners are given as 2-D X/Y
arrays rather than two axis vectors. plotpress scan-converts that curvilinear
mesh to a single image in pure NumPy – no per-cell polygons, and no compiled
extension doing the sampling.
Live figure — pick a tool, then zoom, pan, point-pick or annotate. Nothing is active until a tool is selected.
View this figure’s Vega export ↗ — the raw JSON spec, rendered live by a real Vega engine.
View this figure’s Vega-Lite export ↗ — the raw JSON spec(s), rendered live by a real Vega-Lite engine.
import numpy as np
import polars as pl
import plotpress

R_IN, R_OUT = 0.35, 1.0          # cylinder radii (m)
OMEGA_IN, OMEGA_OUT = 3.0, 0.4   # angular velocity of each cylinder (rad/s)

r = np.linspace(R_IN, R_OUT, 90)
theta = np.linspace(0.0, 2.0 * np.pi, 360)
R, THETA = np.meshgrid(r, theta, indexing="ij")

# Laminar solution v(r) = A r + B / r, with A and B fixed by the no-slip
# condition at each cylinder wall.
denom = R_OUT ** 2 - R_IN ** 2
A = (OMEGA_OUT * R_OUT ** 2 - OMEGA_IN * R_IN ** 2) / denom
B = (OMEGA_IN - OMEGA_OUT) * R_IN ** 2 * R_OUT ** 2 / denom
v = A * R + B / R

# Modulate azimuthally so the field varies in both directions; the envelope
# vanishes at both walls, where the no-slip condition pins the velocity.
envelope = np.sin(np.pi * (R - R_IN) / (R_OUT - R_IN))
v = v * (1.0 + 0.18 * np.sin(6.0 * THETA) * envelope)

X, Y = R * np.cos(THETA), R * np.sin(THETA)

# One row per (r, theta) grid node -- the shape a solver's own polar-grid
# export is in, before the curvilinear x/y mesh is reconstructed from it.
grid_shape = (r.size, theta.size)
field = pl.DataFrame({
    "r": R.ravel(), "theta": THETA.ravel(),
    "x": X.ravel(), "y": Y.ravel(), "v": v.ravel(),
}).sort(["r", "theta"])
X = field["x"].to_numpy().reshape(grid_shape)
Y = field["y"].to_numpy().reshape(grid_shape)
v = field["v"].to_numpy().reshape(grid_shape)

fig, ax = plotpress.subplots(figsize=(6.5, 6.0))
mesh = ax.pcolormesh(X, Y, v, cmap="plasma")
bar = fig.colorbar(mesh, ax=ax)
bar.set_title("v (m/s)")
ax.set_aspect("equal")
ax.set_xlabel("x (m)")
ax.set_ylabel("y (m)")
ax.set_title("Taylor-Couette azimuthal velocity")
fig.tight_layout()
Total running time of the script: (0 minutes 15.923 seconds)