Note
Go to the end to download the full example code.
Vorticity with velocity vectors
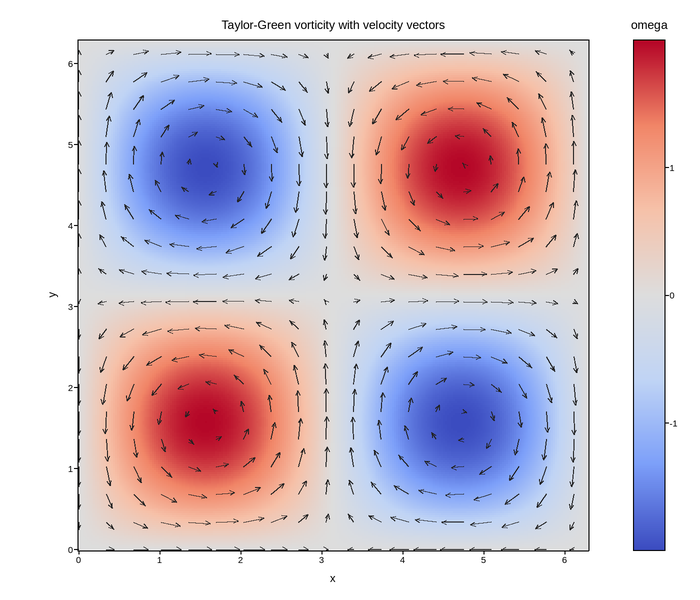
A Taylor-Green vortex array, the standard closed-form test case for
incompressible flow solvers. The mesh carries scalar vorticity; a thinned
quiver overlays the velocity field that produced it, so direction and
rotation are readable together.
Two details make the pairing work. The color limits are set symmetrically about
zero (vmin=-lim, vmax=+lim) so the diverging colormap puts irrotational
flow at its neutral midpoint rather than wherever the data happens to straddle.
And the arrows are subsampled by slicing the grid – one arrow per 14 cells –
because a vector per cell would bury the field it is meant to annotate.
Live figure — pick a tool, then zoom, pan, point-pick or annotate. Nothing is active until a tool is selected.
View this figure’s Vega export ↗ — the raw JSON spec, rendered live by a real Vega engine.
View this figure’s Vega-Lite export ↗ — the raw JSON spec(s), rendered live by a real Vega-Lite engine.
import numpy as np
import polars as pl
import plotpress

g = np.linspace(0.0, 2.0 * np.pi, 260)
X, Y = np.meshgrid(g, g)

U = np.sin(X) * np.cos(Y)                 # velocity components
V = -np.cos(X) * np.sin(Y)
vorticity = 2.0 * np.sin(X) * np.sin(Y)   # curl of (U, V)

# One row per grid node -- the shape a flow solver's own field export is in,
# before it is gridded for the mesh and quiver.
field = pl.DataFrame({
    "x": X.ravel(), "y": Y.ravel(),
    "u": U.ravel(), "v": V.ravel(), "vorticity": vorticity.ravel(),
}).sort(["y", "x"])
g = field["x"].unique().sort().to_numpy()
shape = (g.size, g.size)
U = field["u"].to_numpy().reshape(shape)
V = field["v"].to_numpy().reshape(shape)
vorticity = field["vorticity"].to_numpy().reshape(shape)
X, Y = np.meshgrid(g, g)

lim = float(np.abs(vorticity).max())
fig, ax = plotpress.subplots(figsize=(7.0, 6.0))
mesh = ax.pcolormesh(g, g, vorticity, cmap="coolwarm", vmin=-lim, vmax=lim)

thin = slice(None, None, 14)
ax.quiver(X[thin, thin], Y[thin, thin], U[thin, thin], V[thin, thin],
          color="#222222")

bar = fig.colorbar(mesh, ax=ax)
bar.set_title("omega")
ax.set_aspect("equal")
ax.set_xlabel("x")
ax.set_ylabel("y")
ax.set_title("Taylor-Green vorticity with velocity vectors")
fig.tight_layout()
Total running time of the script: (0 minutes 0.260 seconds)