Note
Go to the end to download the full example code.
Infrared thermography of a board
A thermal camera frame of a populated circuit board under load – the standard way to find a component dissipating more than it should, or a via that is not carrying the heat it was meant to.
The camera reports apparent temperature, and the useful reading is the rise
above ambient rather than the absolute value, so the scale is anchored at the
measured ambient and spans to the hottest device. Pinning vmin to ambient
rather than autoscaling matters: it makes two frames comparable, and it stops a
board that is uniformly warm from looking as dramatic as one with a genuine
hotspot.
An inferno-style sequential map is conventional here and is the right shape for the data – temperature rise is positive with no meaningful midpoint, so a diverging map would invent a reference the measurement does not have.
Isotherms mark the thermal design limits: the 85 degC contour is the commercial component ceiling, and the regulator crosses it.
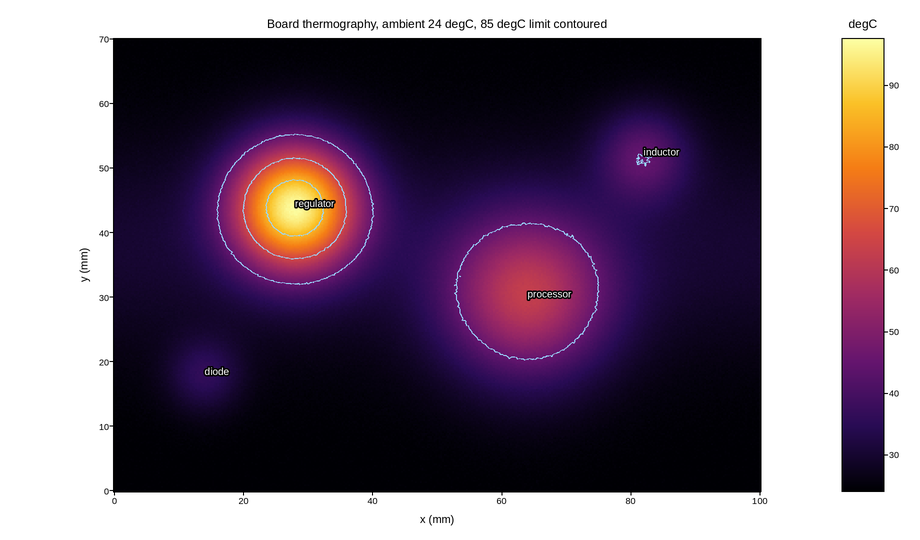
Live figure — pick a tool, then zoom, pan, point-pick or annotate. Nothing is active until a tool is selected.
View this figure’s Vega export ↗ — the raw JSON spec, rendered live by a real Vega engine.
View this figure’s Vega-Lite export ↗ — the raw JSON spec(s), rendered live by a real Vega-Lite engine.
import numpy as np
import polars as pl
import plotpress

rng = np.random.default_rng(71)
AMBIENT = 24.0                              # degC

x = np.linspace(0.0, 100.0, 380)            # mm
y = np.linspace(0.0, 70.0, 300)
X, Y = np.meshgrid(x, y)

# Each source spreads roughly as a 2-D diffusion kernel through the copper.
SOURCES = [(28.0, 44.0, 68.0, 7.0, "regulator"),
           (64.0, 30.0, 34.0, 9.0, "processor"),
           (82.0, 52.0, 18.0, 5.0, "inductor"),
           (14.0, 18.0, 11.0, 4.0, "diode")]

rise = np.zeros_like(X)
for cx, cy, peak, spread, _ in SOURCES:
    rise += peak * np.exp(-((X - cx) ** 2 + (Y - cy) ** 2) / (2 * spread ** 2))

# A copper pour conducts heat along the board, warming a broad band.
rise += 6.0 * np.exp(-((Y - 38.0) ** 2) / 260.0)
rise += rng.normal(0.0, 0.25, rise.shape)   # detector NETD

temperature = AMBIENT + np.clip(rise, 0.0, None)

# One row per camera pixel -- the shape a thermal camera's own frame export
# is in, before it is gridded for the mesh and contour.
frame = pl.DataFrame({"x": X.ravel(), "y": Y.ravel(), "temperature": temperature.ravel()}) \
    .sort(["y", "x"])
x = frame["x"].unique().sort().to_numpy()
y = frame["y"].unique().sort().to_numpy()
temperature = frame["temperature"].to_numpy().reshape(y.size, x.size)
X, Y = np.meshgrid(x, y)

fig, ax = plotpress.subplots(figsize=(9.2, 5.4))
mesh = ax.pcolormesh(x, y, temperature, cmap="inferno",
                     vmin=AMBIENT, vmax=float(temperature.max()))
ax.contour(X, Y, temperature, levels=[45.0, 65.0, 85.0], colors="#9ad8ff")
fig.colorbar(mesh, ax=ax).set_title("degC")
for cx, cy, _, _, label in SOURCES:
    ax.text(cx, cy, label, color="#ffffff")
ax.set_aspect("equal")
ax.set_xlabel("x (mm)")
ax.set_ylabel("y (mm)")
ax.set_title(f"Board thermography, ambient {AMBIENT:.0f} degC, 85 degC limit contoured")
fig.tight_layout()
Total running time of the script: (0 minutes 4.291 seconds)