Note
Go to the end to download the full example code.
The yield curve reshaping month by month
The same eight Nelson-Siegel-style curves from Yield curve evolution and the 2s10s spread, now with every month in between them filled in by linear interpolation of the three shape parameters and stepped through as an animation. Eight snapshots make the point that the curve changed; watching it move makes clear how – not a single curve sliding up and down, but the short end and the long end pivoting at different rates, which is exactly what a one-number summary like the 10-year yield cannot show.
The inversion is the event the whole gallery entry exists to catch, and here it is not a shaded region on a finished chart but a moment the curve visibly passes through: this run opens already inverted, short rates above long, and the curve pivots level and then normal over the following year – a transition that takes real time, multiple frames, to complete. Freezing the animation on any single early frame would show “inverted” as though it were a fact about the curve in general, when it is a fact about that one month.
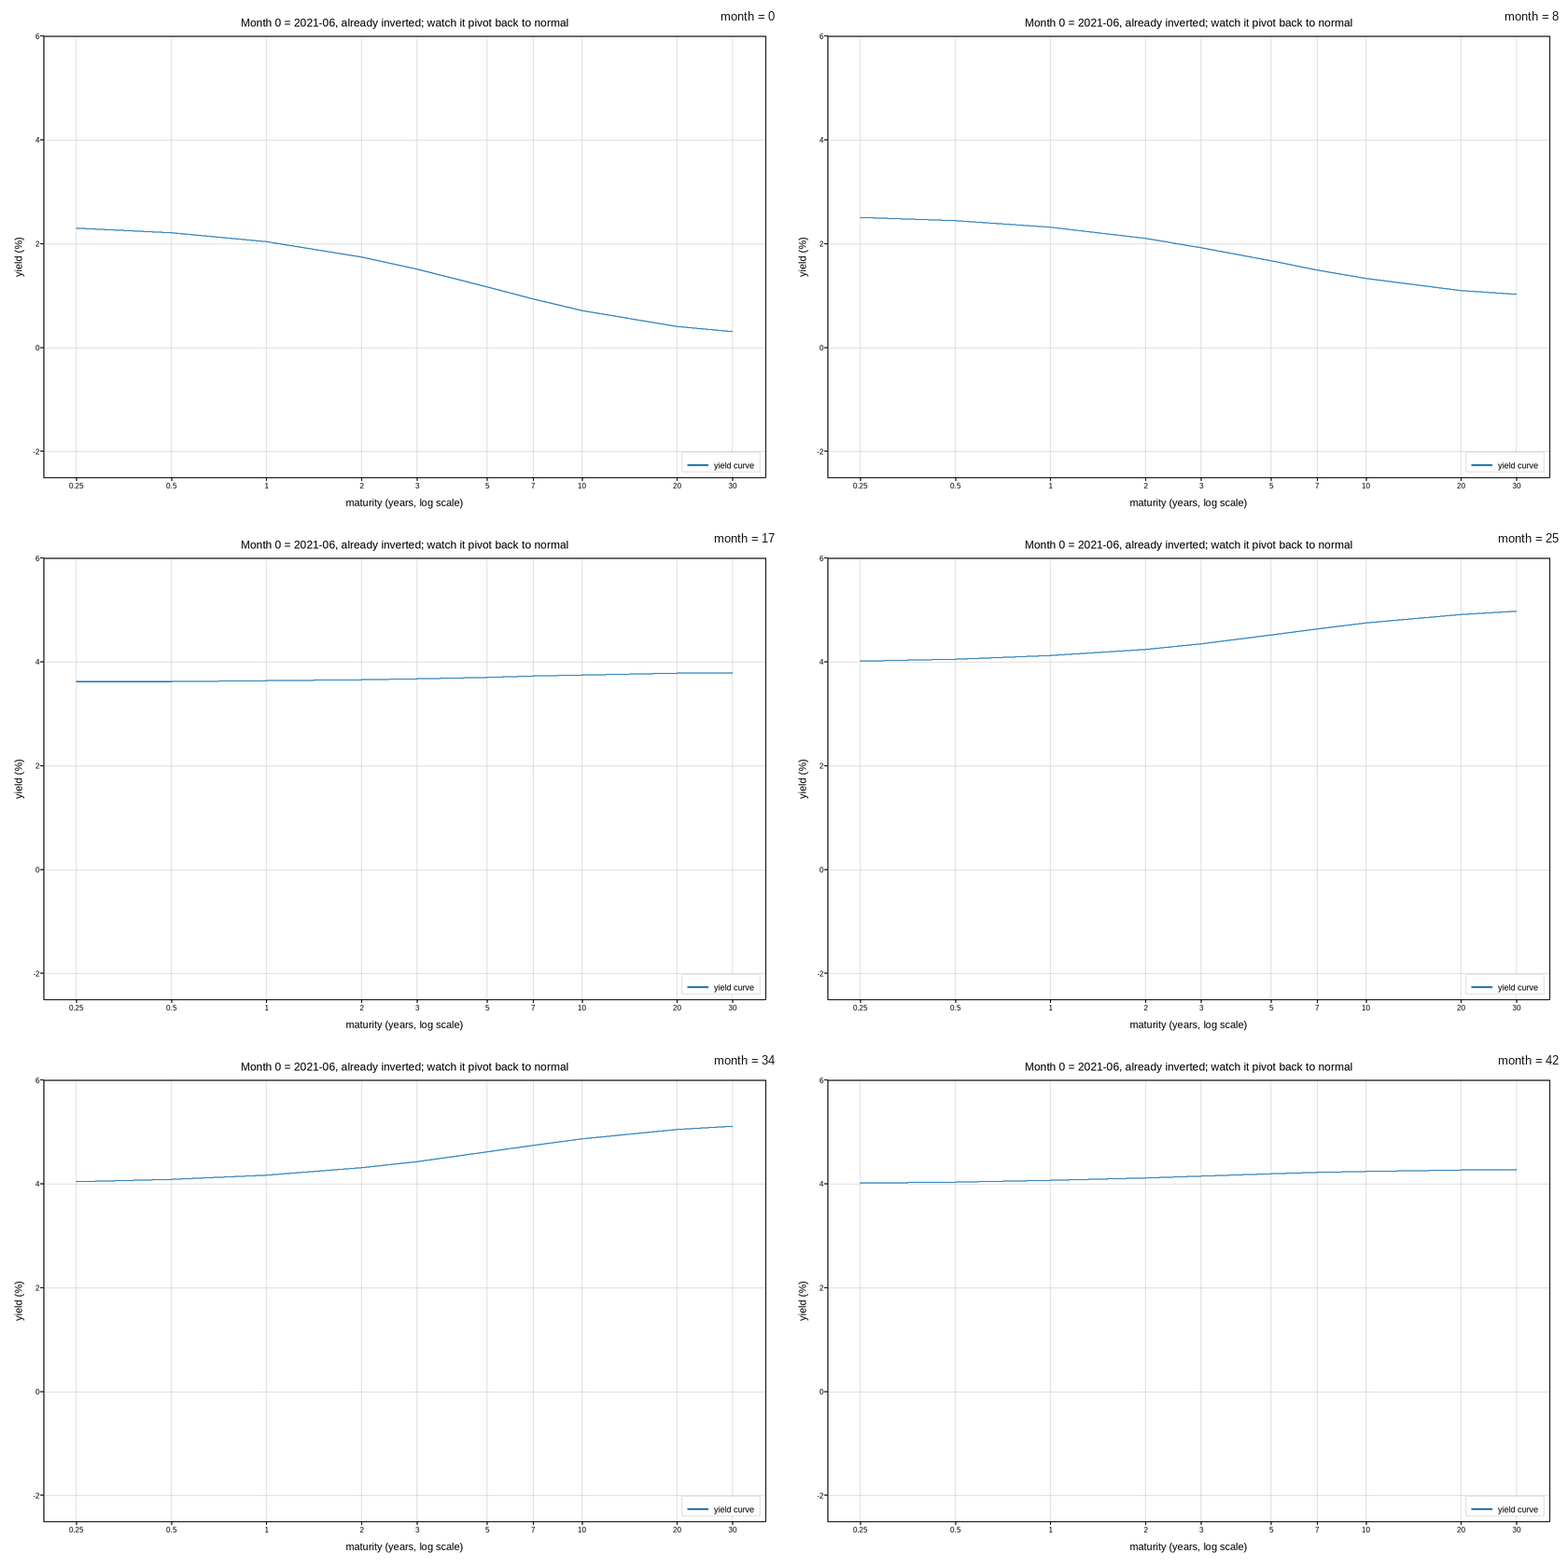
Live figure — pick a tool, then zoom, pan, point-pick or annotate. Nothing is active until a tool is selected.
import os
import tempfile

import numpy as np
import plotpress

MATURITIES = np.array([0.25, 0.5, 1, 2, 3, 5, 7, 10, 20, 30], float)
TAU = 2.2

# The same eight anchor dates as the static example -- level, slope,
# curvature -- interpolated monthly to animate the shape changing between
# them rather than jumping from one snapshot to the next.
ANCHORS = [
    (0.10, 2.30, 0.55), (0.35, 2.05, 0.50), (1.90, 1.05, 0.30),
    (4.20, -0.45, -0.20), (5.05, -1.05, -0.45), (5.30, -1.40, -0.55),
    (5.20, -1.15, -0.40), (4.30, -0.30, 0.05),
]
MONTHS_PER_GAP = 6
anchor_idx = np.arange(len(ANCHORS)) * MONTHS_PER_GAP
n_months = anchor_idx[-1] + 1
month = np.arange(n_months)
level = np.interp(month, anchor_idx, [a[0] for a in ANCHORS])
slope = np.interp(month, anchor_idx, [a[1] for a in ANCHORS])
curvature = np.interp(month, anchor_idx, [a[2] for a in ANCHORS])


def nelson_siegel(lvl, slp, curv):
    x = MATURITIES / TAU
    decay = (1.0 - np.exp(-x)) / x
    return lvl + slp * decay + curv * (decay - np.exp(-x))


yields = np.stack([nelson_siegel(level[m], slope[m], curvature[m])
                   for m in range(n_months)])

fig, ax = plotpress.subplots(figsize=(8.4, 5.6))
ax.plot_frames(MATURITIES, yields, slider_values=month, slider_label="month",
              color="#1f77b4", label="yield curve")
ax.set_xscale("log")
ax.set_xticks(MATURITIES, [f"{m:g}" for m in MATURITIES])
ax.tick_params(labelsize=8)
ax.set_ylim(-2.5, 6.0)
ax.set_xlabel("maturity (years, log scale)")
ax.set_ylabel("yield (%)")
ax.set_title("Month 0 = 2021-06, already inverted; watch it pivot back to normal")
ax.legend(loc="lower right")
ax.grid(True)
fig.tight_layout()

gif_path = os.path.join(tempfile.gettempdir(), "plotpress_yield_curve_animated.gif")
fig.save(gif_path, fps=10)
Total running time of the script: (0 minutes 9.108 seconds)