Note
Go to the end to download the full example code.
Annotating a price series: a single event vs. a whole regime
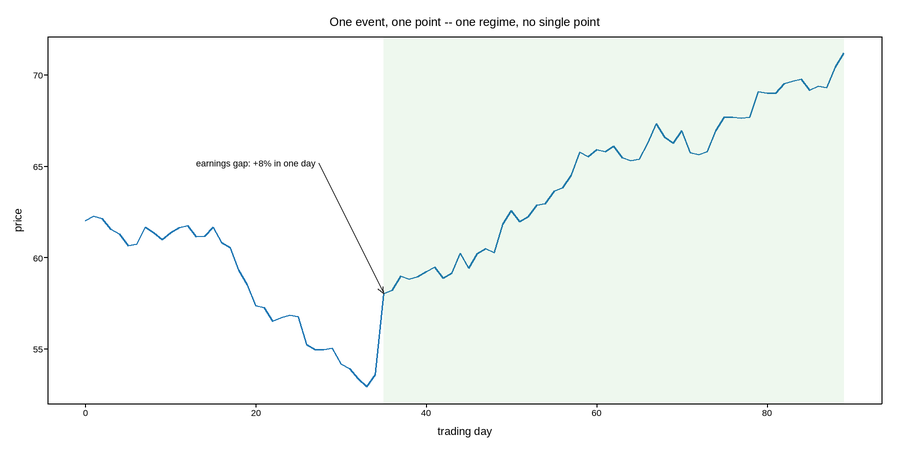
Some things worth marking on a chart belong to one exact point – an earnings gap happened on one specific day, at one specific price. Others describe a whole stretch with no single tick that defines it – the weeks the market spent re-rating the stock upward afterward have no one day that is the re-rating.
plotpress’s interactive HTML lets you drop either kind of note yourself, on the live copy of this figure below, via three Annotate tools that match the two cases above (plus a third, in between): Annotate Point locks a note to the nearest actual close, the same snap Point Picking itself uses – click near the gap day and the note reads as being about that one candle, not wherever the cursor happened to land. Annotate drops a plain caption pinned to a fixed spot on the figure, no dot, no arrow – click in the open margin, or anywhere in the re-rating band, for a caption that reads as being about the stretch, not a point. Annotate Arrow sits between the two: a dot and a leader arrow pointing at exactly wherever you clicked, whether or not that happens to be a real data point.
The static annotation below (drawn with ax.annotate(), the same method
the drawdown example elsewhere in this gallery uses) marks the gap itself,
since that is the one thing about this chart every reader needs to see
without touching anything. Try the live version’s Annotate tools for the
kind of note that is yours alone, not the author’s.
Live figure — pick a tool, then zoom, pan, point-pick or annotate. Nothing is active until a tool is selected.
View this figure’s Vega export ↗ — the raw JSON spec, rendered live by a real Vega engine.
View this figure’s Vega-Lite export ↗ — the raw JSON spec(s), rendered live by a real Vega-Lite engine.
import numpy as np
import polars as pl
import plotpress

rng = np.random.default_rng(7)

DAYS = 90
t = np.arange(DAYS)

# A quiet pre-earnings regime, a one-day gap on the earnings print, then a
# sustained higher drift as the market re-rates the stock upward -- not a
# single day, but the whole stretch after the gap.
GAP_DAY = 35
pre_drift, post_drift = 0.0006, 0.0035
vol = 0.011

drift = np.where(t < GAP_DAY, pre_drift, post_drift)
returns = drift + rng.normal(0.0, vol, DAYS)
returns[GAP_DAY] += 0.085          # the earnings gap itself

# One row per trading day -- the shape a price series is actually recorded
# in, before the earnings-gap day is picked out of it.
daily = pl.DataFrame({"day": t, "return": returns,
                       "price": 62.0 * np.exp(np.cumsum(returns))})
t = daily["day"].to_numpy()
price = daily["price"].to_numpy()
gap = daily.row(GAP_DAY, named=True)

fig, ax = plotpress.subplots(figsize=(9, 4.5))
ax.plot(t, price, color="#1f77b4", linewidth=1.3)
ax.axvspan(GAP_DAY, DAYS - 1, color="#2ca02c", alpha=0.08)
ax.annotate(f"earnings gap: +{gap['return'] * 100:.0f}% in one day",
            xy=(GAP_DAY, gap["price"]),
            xytext=(GAP_DAY - 22, gap["price"] * 1.12),
            arrowprops={"color": "#333333"}, fontsize=9)
ax.set_xlabel("trading day")
ax.set_ylabel("price")
ax.set_title("One event, one point -- one regime, no single point")
fig.tight_layout()
Total running time of the script: (0 minutes 0.106 seconds)