Note
Go to the end to download the full example code.
SAR interferogram: wrapped phase
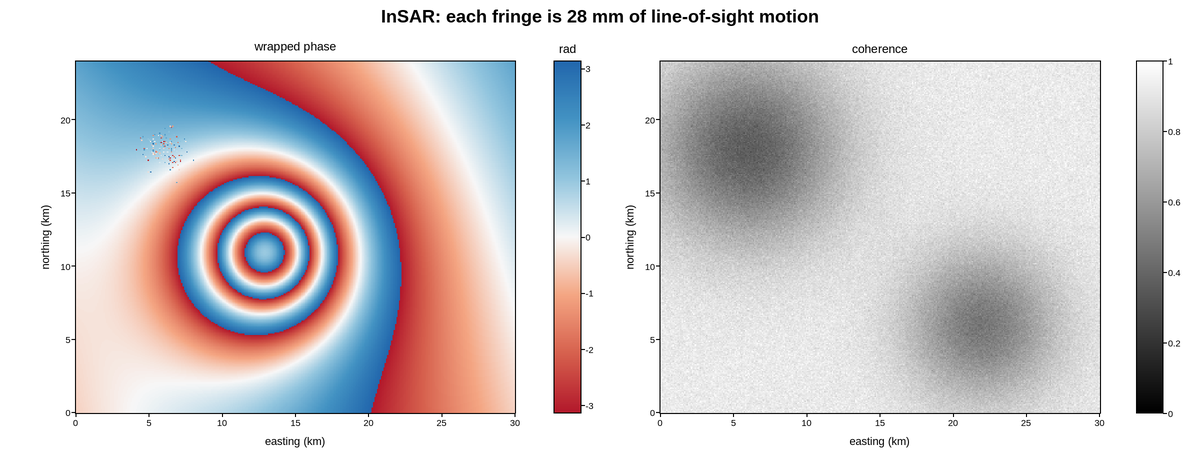
An InSAR interferogram: the phase difference between two radar passes over the same ground, which measures how far the surface moved along the line of sight between them. Each full fringe is half a radar wavelength – about 28 mm for C-band – so the concentric rings here are ground deformation over a deflating magma chamber, plus a broad topographic ramp.
Phase is cyclic. It is only ever known modulo 2*pi, so the measurement wraps: +pi and -pi are the same physical phase, and the fringes are that wrapping made visible. Unwrapping to absolute displacement is a separate, error-prone processing step, and interferograms are routinely inspected wrapped.
That cyclic nature is a genuine mismatch with every colormap plotpress bundles,
all of which run end to end rather than joining back up. A wrapped-phase map
really wants a cyclic colormap so that +pi and -pi share a colour; drawn with
a diverging one, the wrap shows as a hard seam that looks like a discontinuity
in the data rather than an artefact of the palette. Symmetric limits at
+/- pi at least keep zero phase at the neutral midpoint and make each fringe
one full sweep of the bar.
The coherence panel beside it shows where the phase is trustworthy at all – vegetation and water decorrelate between passes, and phase there is noise.
Live figure — pick a tool, then zoom, pan, point-pick or annotate. Nothing is active until a tool is selected.
View this figure’s Vega export ↗ — the raw JSON spec, rendered live by a real Vega engine.
View this figure’s Vega-Lite export ↗ — the raw JSON spec(s), rendered live by a real Vega-Lite engine.
import numpy as np
import polars as pl
import plotpress

rng = np.random.default_rng(29)
east = np.linspace(0.0, 30.0, 340)        # km
north = np.linspace(0.0, 24.0, 300)
E, N = np.meshgrid(east, north)

# Deformation: a Mogi point source under (13, 11) km, plus a topographic ramp.
r = np.hypot(E - 13.0, N - 11.0)
DEPTH = 5.0
los_mm = -95.0 * DEPTH / (r ** 2 + DEPTH ** 2) ** 1.5 * DEPTH ** 2
los_mm += 0.9 * E + 0.4 * N                       # residual orbital ramp

WAVELENGTH_MM = 55.5                              # C-band
phase = 4.0 * np.pi * los_mm / WAVELENGTH_MM
wrapped = np.angle(np.exp(1j * phase))            # fold into (-pi, pi]

# Coherence: high on bare rock, low over vegetation and the lake.
coherence = 0.92 - 0.45 * np.exp(-((E - 22.0) ** 2 + (N - 6.0) ** 2) / 26.0)
coherence -= 0.55 * np.exp(-((E - 6.0) ** 2 + (N - 18.0) ** 2) / 40.0)
coherence = np.clip(coherence + rng.normal(0.0, 0.03, E.shape), 0.05, 0.99)
wrapped = np.where(coherence > 0.35, wrapped,
                   rng.uniform(-np.pi, np.pi, E.shape))

# One row per (easting, northing) pixel -- sorted before the reshape below
# so the pivot back to a grid is correct regardless of row order.
pixels = pl.DataFrame({
    "east_km": E.ravel(), "north_km": N.ravel(),
    "phase_rad": wrapped.ravel(), "coherence": coherence.ravel(),
}).sort(["north_km", "east_km"])

east_axis = pixels["east_km"].unique().sort().to_numpy()
north_axis = pixels["north_km"].unique().sort().to_numpy()
shape = (north_axis.size, east_axis.size)
wrapped = pixels["phase_rad"].to_numpy().reshape(shape)
coherence = pixels["coherence"].to_numpy().reshape(shape)

fig, axes = plotpress.subplots(1, 2, figsize=(12.0, 4.6))
ifg = axes[0].pcolormesh(east_axis, north_axis, wrapped, cmap="RdBu",
                         vmin=-np.pi, vmax=np.pi)
axes[0].set_title("wrapped phase")
fig.colorbar(ifg, ax=axes[0]).set_title("rad")

coh = axes[1].pcolormesh(east_axis, north_axis, coherence, cmap="gray", vmin=0.0, vmax=1.0)
axes[1].set_title("coherence")
fig.colorbar(coh, ax=axes[1])

for ax in axes:
    ax.set_aspect("equal")
    ax.set_xlabel("easting (km)")
    ax.set_ylabel("northing (km)")
fig.suptitle("InSAR: each fringe is 28 mm of line-of-sight motion")
fig.tight_layout()
Total running time of the script: (0 minutes 0.473 seconds)