Note
Go to the end to download the full example code.
Hovmoller diagram of convection
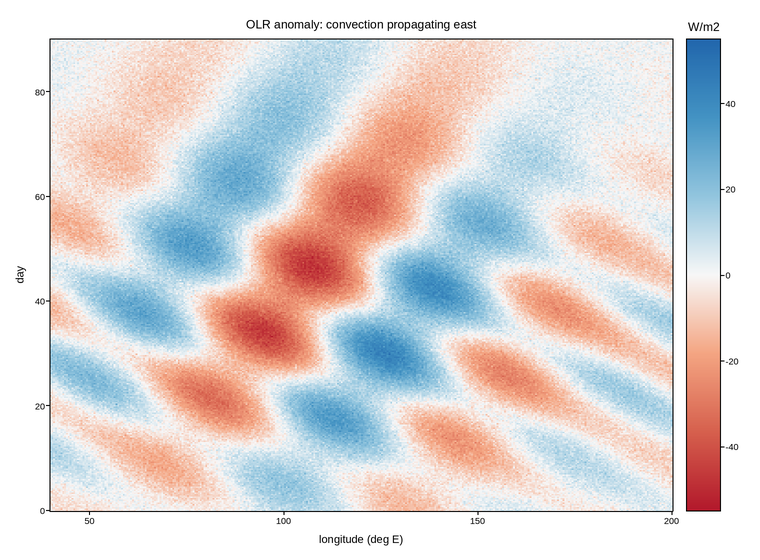
A Hovmoller diagram: outgoing longwave radiation anomaly against longitude and time, the standard way tropical meteorologists watch convection propagate. Space on one axis and time on the other turns a travelling disturbance into a tilted stripe whose slope is its phase speed.
OLR anomaly is negative where deep cloud is cold at the top – so negative means convection, positive means clear sky, and zero means climatology. The sign carries the meaning, so the map is diverging with limits symmetric about zero.
The eastward tilt here is a Madden-Julian Oscillation signal at roughly 5 m/s; the steeper westward streaks are faster equatorial Rossby waves.
Live figure — pick a tool, then zoom, pan, point-pick or annotate. Nothing is active until a tool is selected.
View this figure’s Vega export ↗ — the raw JSON spec, rendered live by a real Vega engine.
View this figure’s Vega-Lite export ↗ — the raw JSON spec(s), rendered live by a real Vega-Lite engine.
import numpy as np
import polars as pl
import plotpress

rng = np.random.default_rng(11)
lon = np.linspace(40.0, 200.0, 340)      # degrees east
day = np.linspace(0.0, 90.0, 320)
LON, DAY = np.meshgrid(lon, day)

# MJO: eastward at ~5 deg/day, envelope strongest over the warm pool.
mjo_phase = (LON - 60.0) / 12.0 - DAY / 12.0
envelope = np.exp(-((LON - 110.0) ** 2) / 3200.0)
olr = -38.0 * envelope * np.cos(mjo_phase) * np.exp(-((DAY - 45.0) ** 2) / 1500.0)

# Faster westward Rossby wave packets riding on top.
olr += -14.0 * np.cos((LON + 2.4 * DAY) / 7.0) * np.exp(-((DAY - 30.0) ** 2) / 900.0)
olr += rng.normal(0.0, 3.0, olr.shape)

# One row per (longitude, day) sample -- sorted before the reshape below so
# the pivot back to a grid is correct regardless of row order.
field = pl.DataFrame({
    "lon": LON.ravel(), "day": DAY.ravel(), "olr": olr.ravel(),
}).sort(["day", "lon"])

lon_axis = field["lon"].unique().sort().to_numpy()
day_axis = field["day"].unique().sort().to_numpy()
olr = field["olr"].to_numpy().reshape(day_axis.size, lon_axis.size)
lim = float(field["olr"].abs().max())

fig, ax = plotpress.subplots(figsize=(7.6, 5.6))
mesh = ax.pcolormesh(lon_axis, day_axis, olr, cmap="RdBu", vmin=-lim, vmax=lim)
fig.colorbar(mesh, ax=ax).set_title("W/m2")
ax.set_xlabel("longitude (deg E)")
ax.set_ylabel("day")
ax.set_title("OLR anomaly: convection propagating east")
fig.tight_layout()
Total running time of the script: (0 minutes 0.518 seconds)