Note
Go to the end to download the full example code.
Weather radar PPI (curvilinear)
A plan-position-indicator scan: a weather radar sweeps its beam in azimuth at
fixed elevation, so every sample arrives on a polar (range, azimuth) grid.
Mapping those cell corners to Cartesian gives 2-D X/Y arrays and a
genuinely curvilinear mesh – resampling to a rectangular grid first would blur
the very gradients a forecaster reads.
Reflectivity is quoted in dBZ, already a log scale, so a linear colour norm over dBZ is the right choice: each 10 dBZ step is a decade in returned power and the conventional thresholds (20 dBZ drizzle, 40 dBZ heavy rain, 55 dBZ hail) sit at even spacings.
Cells below the noise floor are nan rather than a large negative sentinel,
so clear air stays unpainted and does not drag the colour range down.
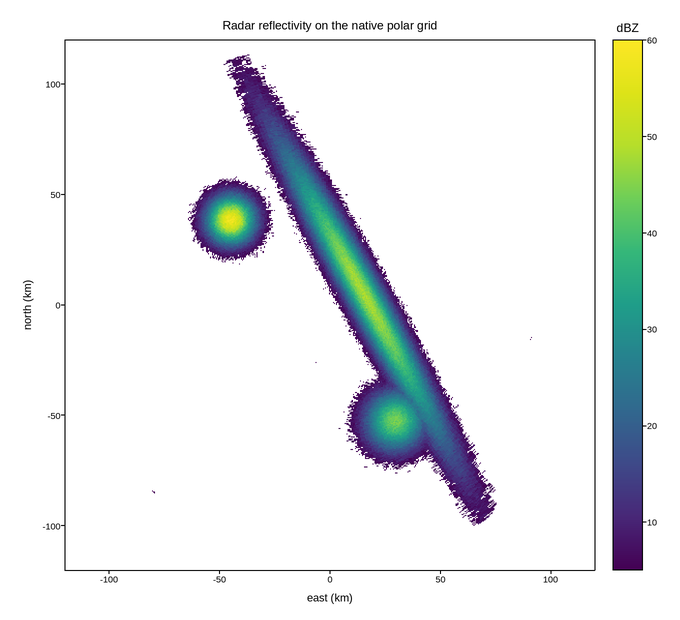
Live figure — pick a tool, then zoom, pan, point-pick or annotate. Nothing is active until a tool is selected.
View this figure’s Vega export ↗ — the raw JSON spec, rendered live by a real Vega engine.
View this figure’s Vega-Lite export ↗ — the raw JSON spec(s), rendered live by a real Vega-Lite engine.
import numpy as np
import polars as pl
import plotpress

rng = np.random.default_rng(5)
rng_km = np.linspace(2.0, 120.0, 300)              # slant range
azimuth = np.radians(np.linspace(0.0, 360.0, 361))  # full sweep
R, AZ = np.meshgrid(rng_km, azimuth)

X = R * np.sin(AZ)          # north up, east right
Y = R * np.cos(AZ)

# A squall line plus a couple of discrete cells.
dbz = np.full_like(R, -5.0)
line = 48.0 * np.exp(-((X + 0.55 * Y - 18.0) ** 2) / 90.0)
line *= np.exp(-((Y - 5.0) ** 2) / 5200.0)
dbz = np.maximum(dbz, line)
for cx, cy, peak, spread in [(-45.0, 38.0, 58.0, 130.0), (30.0, -52.0, 44.0, 200.0)]:
    dbz = np.maximum(dbz, peak * np.exp(-((X - cx) ** 2 + (Y - cy) ** 2) / spread))

dbz += rng.normal(0.0, 1.2, dbz.shape)
dbz[dbz < 5.0] = np.nan                # below the noise floor: no echo

# One row per (range, azimuth) radar cell -- sorted before the reshape below
# so the pivot back to a grid is correct regardless of row order. The
# display grid (x, y) is curvilinear, so it is reshaped alongside dbz rather
# than treated as a separable axis.
scan = pl.DataFrame({
    "range_km": R.ravel(), "azimuth_rad": AZ.ravel(),
    "x": X.ravel(), "y": Y.ravel(), "dbz": dbz.ravel(),
}).sort(["azimuth_rad", "range_km"])

grid_shape = (scan["azimuth_rad"].n_unique(), scan["range_km"].n_unique())
X = scan["x"].to_numpy().reshape(grid_shape)
Y = scan["y"].to_numpy().reshape(grid_shape)
dbz = scan["dbz"].to_numpy().reshape(grid_shape)

fig, ax = plotpress.subplots(figsize=(6.8, 6.2))
mesh = ax.pcolormesh(X, Y, dbz, cmap="viridis", vmin=5.0, vmax=60.0)
fig.colorbar(mesh, ax=ax).set_title("dBZ")
ax.set_aspect("equal")
ax.set_xlabel("east (km)")
ax.set_ylabel("north (km)")
ax.set_title("Radar reflectivity on the native polar grid")
fig.tight_layout()
Total running time of the script: (0 minutes 14.803 seconds)