Note
Go to the end to download the full example code.
Sea-surface temperature with a land mask
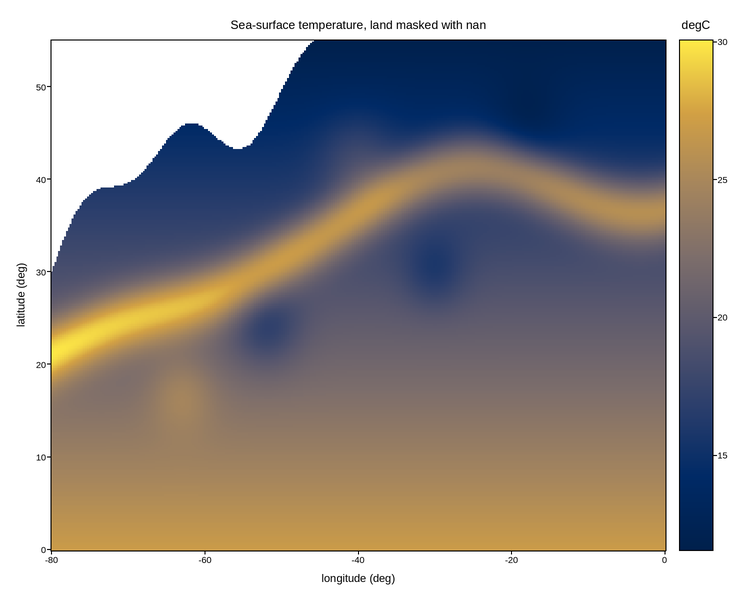
Real gridded observations are rarely complete: satellites see water but not
land, instruments drop out, retrievals fail quality control. Mark those cells
nan and they are simply left unpainted – the axes background shows through,
and the color range is set by the valid data alone, so one masked continent does
not flatten the scale for everything else.
Live figure — pick a tool, then zoom, pan, point-pick or annotate. Nothing is active until a tool is selected.
View this figure’s Vega export ↗ — the raw JSON spec, rendered live by a real Vega engine.
View this figure’s Vega-Lite export ↗ — the raw JSON spec(s), rendered live by a real Vega-Lite engine.
import numpy as np
import polars as pl
import plotpress

lon = np.linspace(-80.0, 0.0, 320)
lat = np.linspace(0.0, 55.0, 280)
LON, LAT = np.meshgrid(lon, lat)

# Broad meridional gradient: warm in the south, cool toward the north.
sst = 27.0 - 0.28 * LAT

# A western boundary current -- a warm filament that hugs the coast, separates
# near 30N and meanders north-east across the basin.
axis = 30.0 + 9.0 * np.tanh((LON + 55.0) / 12.0) + 2.5 * np.sin((LON + 80.0) / 7.0)
sst += 9.0 * np.exp(-((LAT - axis) ** 2) / 12.0)

# Mesoscale eddies shed to either side of the current.
for clon, clat, amp, rad in [(-52.0, 24.0, -3.5, 3.2),
                             (-40.0, 42.0, 3.0, 3.6),
                             (-30.0, 30.0, -2.6, 2.8),
                             (-63.0, 17.0, 2.4, 3.0),
                             (-18.0, 46.0, -2.0, 3.4)]:
    sst += amp * np.exp(-((LON - clon) ** 2 + (LAT - clat) ** 2) / (2.0 * rad ** 2))

# An irregular coastline in the north-west. Land is nan, not a sentinel value
# like -999 that would silently stretch the color scale over the whole ocean.
coast = (30.0 + 0.75 * (LON + 80.0)
         + 4.0 * np.sin((LON + 80.0) / 6.0)
         + 2.0 * np.sin((LON + 80.0) / 2.3))
sst[LAT > coast] = np.nan

# One row per grid cell -- sorted before the reshape below so the pivot back
# to a grid is correct regardless of row order.
field = pl.DataFrame({
    "lon": LON.ravel(), "lat": LAT.ravel(), "sst": sst.ravel(),
}).sort(["lat", "lon"])

lon_axis = field["lon"].unique().sort().to_numpy()
lat_axis = field["lat"].unique().sort().to_numpy()
sst = field["sst"].to_numpy().reshape(lat_axis.size, lon_axis.size)

fig, ax = plotpress.subplots(figsize=(7.5, 6))
mesh = ax.pcolormesh(lon_axis, lat_axis, sst, cmap="cividis")
bar = fig.colorbar(mesh, ax=ax)
bar.set_title("degC")
ax.set_xlabel("longitude (deg)")
ax.set_ylabel("latitude (deg)")
ax.set_title("Sea-surface temperature, land masked with nan")
fig.tight_layout()
Total running time of the script: (0 minutes 0.364 seconds)