Note
Go to the end to download the full example code.
Third-octave noise spectrum against a limit curve
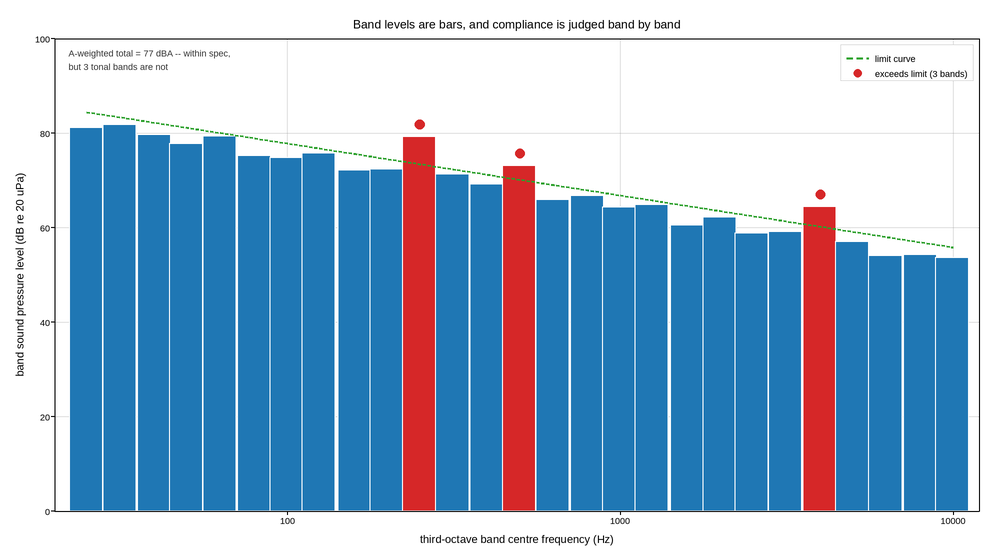
A machinery noise measurement in third-octave bands, checked against a noise rating limit. Band levels are drawn as bars because they are band quantities: each number is the energy in a frequency interval, not a value at a frequency, and a line joining them would imply a continuous spectrum that was never measured.
The x axis is logarithmic because third-octave bands are geometrically spaced by construction – each centre frequency is the previous one times 2^(1/3). On a linear axis the twelve bands below 200 Hz, where most machinery problems live, would occupy a twentieth of the width. Bars on a log axis need their widths computed in the log domain too, which is why each bar’s width comes from its own band edges rather than from a single constant.
The limit curve is the point of the measurement, so it is drawn on the same axes rather than quoted in the caption, and the two bands that exceed it are coloured differently. Compliance is per band, not on average, so highlighting exactly which bands fail is the result – an overall dBA figure would report this machine as passing.
The A-weighted total is annotated because it is what the specification is usually written in, and it belongs on the figure that shows it is not the whole story.
Live figure — pick a tool, then zoom, pan, point-pick or annotate. Nothing is active until a tool is selected.
View this figure’s Vega export ↗ — the raw JSON spec, rendered live by a real Vega engine.
View this figure’s Vega-Lite export ↗ — the raw JSON spec(s), rendered live by a real Vega-Lite engine.
import numpy as np
import polars as pl
import plotpress

# Standard third-octave centre frequencies, 25 Hz to 10 kHz.
centres = np.array([25, 31.5, 40, 50, 63, 80, 100, 125, 160, 200, 250, 315,
                    400, 500, 630, 800, 1000, 1250, 1600, 2000, 2500, 3150,
                    4000, 5000, 6300, 8000, 10000], float)
edges_lo = centres / 2.0 ** (1.0 / 6.0)
edges_hi = centres * 2.0 ** (1.0 / 6.0)

rng = np.random.default_rng(120)

# Broadband machinery noise: falling with frequency, plus a fan blade-pass tone
# and its harmonic, and a gear mesh whine up top.
level = 82.0 - 11.0 * np.log10(centres / 25.0)
level += 9.0 * np.exp(-((np.log2(centres / 250.0)) ** 2) / 0.03)     # blade pass
level += 6.5 * np.exp(-((np.log2(centres / 500.0)) ** 2) / 0.03)     # 2nd harmonic
level += 7.0 * np.exp(-((np.log2(centres / 4000.0)) ** 2) / 0.05)    # gear mesh
level += rng.normal(0.0, 1.1, centres.size)

# The limit: a noise-rating style curve, permissive at low frequency. It sits a
# little above the broadband trend, so only the tonal peaks breach it -- which
# is the usual real situation and the one worth drawing.
limit = 84.5 - 11.0 * np.log10(centres / 25.0)

# A-weighting, so the single-number total can be quoted.
f2 = centres ** 2
ra = (12194.0 ** 2 * f2 ** 2) / ((f2 + 20.6 ** 2)
                                 * np.sqrt((f2 + 107.7 ** 2) * (f2 + 737.9 ** 2))
                                 * (f2 + 12194.0 ** 2))
a_weight = 20.0 * np.log10(ra) + 2.0
total_dba = 10.0 * np.log10(np.sum(10.0 ** ((level + a_weight) / 10.0)))

exceeds = level > limit

# One row per third-octave band -- the shape a real analyzer readout is
# logged in, before it is ever split into "pass" and "fail" bars.
bands = pl.DataFrame({
    "centre_hz": centres,
    "edge_lo_hz": edges_lo,
    "edge_hi_hz": edges_hi,
    "level_db": level,
    "limit_db": limit,
    "exceeds": exceeds,
})

fig, ax = plotpress.subplots(figsize=(10.0, 5.6))
for row in bands.iter_rows(named=True):
    # Width per bar, from that band's own edges: on a log axis a constant width
    # in hertz is a wildly different width on screen at 25 Hz and at 10 kHz.
    ax.bar([np.sqrt(row["edge_lo_hz"] * row["edge_hi_hz"])], [row["level_db"]],
           width=(row["edge_hi_hz"] - row["edge_lo_hz"]),
           color="#d62728" if row["exceeds"] else "#1f77b4", edgecolor="#ffffff",
           label=None)

failing = bands.filter(pl.col("exceeds"))
ax.plot(bands["centre_hz"].to_numpy(), bands["limit_db"].to_numpy(),
        color="#2ca02c", linewidth=2.0, linestyle="--", label="limit curve")
ax.scatter(failing["centre_hz"].to_numpy(), failing["level_db"].to_numpy() + 2.5,
           s=7.0, color="#d62728", label=f"exceeds limit ({failing.height} bands)")

# The bars stop well short of the top of the axes, so the headroom above the
# high-frequency end is the one place a two-line note does not cross them.
ax.text(22.0, 98.0, f"A-weighted total = {total_dba:.0f} dBA -- within spec,\n"
        f"but {failing.height} tonal bands are not", fontsize=9,
        color="#333333", ha="left", va="top")

ax.set_xscale("log")
ax.set_xlim(20.0, 12000.0)
ax.set_ylim(0.0, 100.0)
ax.set_xlabel("third-octave band centre frequency (Hz)")
ax.set_ylabel("band sound pressure level (dB re 20 uPa)")
ax.set_title("Band levels are bars, and compliance is judged band by band")
ax.legend(loc="upper right")
ax.grid(True)
fig.tight_layout()
Total running time of the script: (0 minutes 0.156 seconds)