Note
Go to the end to download the full example code.
V-n flight envelope
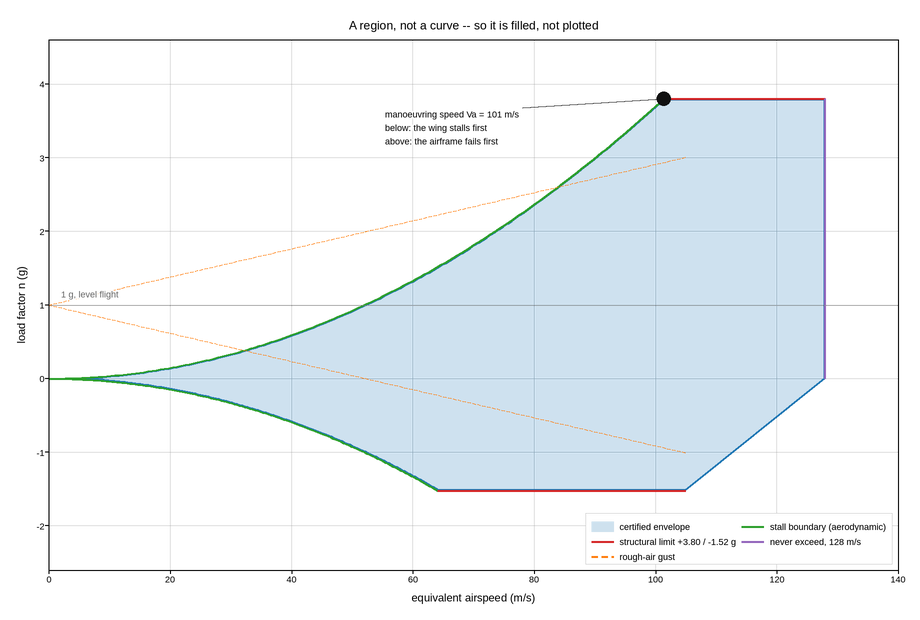
The load-factor against airspeed diagram that defines what an aircraft is certified to do. Unlike almost every other figure in this gallery it is not a plot of measurements: it is a plot of boundaries, and the quantity of interest is the enclosed region rather than any curve on it.
That makes fill the right primitive rather than plot. The envelope is a
closed polygon assembled from four different physical limits, and filling it
states plainly that everything inside is permitted and everything outside is
not. Drawing the four limits as four separate lines would leave the reader to
work out which side of each is safe.
The limits themselves come from different physics and are labelled accordingly. The curved left-hand boundaries are aerodynamic: the wing stalls, and the stall speed rises as the square root of load factor, so they are parabolas. The horizontal boundaries are structural – the airframe’s design limits, +3.8g and -1.52g here. The vertical boundary on the right is the never-exceed speed, set by flutter and compressibility.
The manoeuvring speed, where the stall parabola meets the positive structural limit, is the most useful point on the diagram: below it the wing stalls before the airframe breaks, above it the reverse. It is marked, along with the gust lines that shrink the usable envelope in turbulence – the reason the certified envelope and the safe envelope are not the same shape.
Live figure — pick a tool, then zoom, pan, point-pick or annotate. Nothing is active until a tool is selected.
View this figure’s Vega export ↗ — the raw JSON spec, rendered live by a real Vega engine.
View this figure’s Vega-Lite export ↗ — the raw JSON spec(s), rendered live by a real Vega-Lite engine.
import numpy as np
import polars as pl
import plotpress

V_S = 52.0                                         # stall speed, 1 g (m/s)
N_MAX, N_MIN = 3.8, -1.52                          # structural limits
V_NE = 128.0                                       # never exceed
V_C = 105.0                                        # design cruise
GUST_SLOPE = 15.2                                  # rough-air gust, m/s

V_A = V_S * np.sqrt(N_MAX)                         # manoeuvring speed
V_NEG = V_S * np.sqrt(abs(N_MIN))

# Walk the boundary once: positive stall arc up to Va, along the structural
# limit to Vne, down to the negative limit, back along it, and down the negative
# stall arc to the origin. One closed ring, so fill() has a polygon to close.
#
# One row per airspeed step along each stall arc -- the shape a flight-test
# boundary table is in, before the two arcs are joined into the closed polygon.
pos_arc = pl.DataFrame({"v": np.linspace(0.0, V_A, 150)}).with_columns(
    n=(pl.col("v") / V_S) ** 2)
pos_arc_v = pos_arc["v"].to_numpy()
pos_arc_n = pos_arc["n"].to_numpy()

neg_arc = pl.DataFrame({"v": np.linspace(0.0, V_NEG, 150)}).with_columns(
    n=-((pl.col("v") / V_S) ** 2))
neg_arc_v = neg_arc["v"].to_numpy()
neg_arc_n = neg_arc["n"].to_numpy()

poly_v = np.concatenate([pos_arc_v, [V_NE, V_NE, V_C], neg_arc_v[::-1]])
poly_n = np.concatenate([pos_arc_n, [N_MAX, 0.0, N_MIN], neg_arc_n[::-1]])

fig, ax = plotpress.subplots(figsize=(9.2, 6.2))
ax.fill(poly_v, poly_n, color="#1f77b4", alpha=0.22, edgecolor="#1f77b4",
        linewidth=2.0, label="certified envelope")

ax.plot(pos_arc_v, pos_arc_n, color="#2ca02c", linewidth=2.0,
        label="stall boundary (aerodynamic)")
ax.plot(neg_arc_v, neg_arc_n, color="#2ca02c", linewidth=2.0)
ax.plot([V_A, V_NE], [N_MAX, N_MAX], color="#d62728", linewidth=2.0,
        label=f"structural limit {N_MAX:+.2f} / {N_MIN:+.2f} g")
ax.plot([V_NEG, V_C], [N_MIN, N_MIN], color="#d62728", linewidth=2.0)
ax.plot([V_NE, V_NE], [0.0, N_MAX], color="#9467bd", linewidth=2.0,
        label=f"never exceed, {V_NE:.0f} m/s")

# The gust lines: one pair is enough to make the point that turbulence eats
# into the envelope. Four would be certification paperwork, not a figure.
gust_v = np.array([0.0, V_C])
gust_n = GUST_SLOPE * gust_v / (V_S ** 2) * 3.4
ax.plot(gust_v, 1.0 + gust_n, color="#ff7f0e", linestyle="--", linewidth=1.2,
        label="rough-air gust")
ax.plot(gust_v, 1.0 - gust_n, color="#ff7f0e", linestyle="--", linewidth=1.2)

ax.scatter([V_A], [N_MAX], s=10.0, color="#111111")
ax.annotate(f"manoeuvring speed Va = {V_A:.0f} m/s\n"
            "below: the wing stalls first\nabove: the airframe fails first",
            xy=(V_A, N_MAX), xytext=(V_A - 46.0, 3.55),
            arrowprops={"color": "#111111"}, fontsize=9)

ax.axhline(1.0, color="#888888", linestyle=":", linewidth=1.1)
ax.text(2.0, 1.10, "1 g, level flight", fontsize=9, color="#666666")

ax.set_xlim(0.0, 140.0)
ax.set_ylim(-2.6, 4.6)
ax.set_xlabel("equivalent airspeed (m/s)")
ax.set_ylabel("load factor n (g)")
ax.set_title("A region, not a curve -- so it is filled, not plotted")
ax.legend(loc="lower right", ncol=2)
ax.grid(True)
fig.tight_layout()
Total running time of the script: (0 minutes 0.170 seconds)