Note
Go to the end to download the full example code.
Wigner function of a cat state
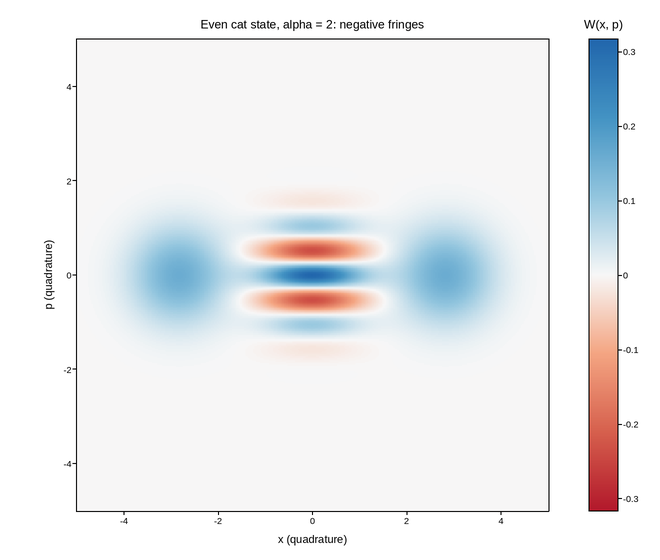
The Wigner quasiprobability distribution of an even Schroedinger cat state,
(|alpha> + |-alpha>) / N, reconstructed in phase space – the standard way
to certify a non-classical cavity state in circuit QED.
- W(x, p) ~ exp(-(x - x0)^2 - p^2) + exp(-(x + x0)^2 - p^2)
2 exp(-x^2 - p^2) cos(2 p x0)
The two Gaussian lobes are the classical mixture; the fringes between them come
from the interference term and are the reason to measure a Wigner function at
all. Because cos swings negative there, W takes negative values –
impossible for any classical probability distribution, and the direct signature
of quantum coherence.
That makes the color mapping load-bearing rather than decorative. The data is
signed and its zero is physically meaningful, so the limits are set
symmetrically about zero (vmin=-lim, vmax=+lim) on a diverging map:
white is exactly W = 0, blue is classical-looking positive quasiprobability,
and every red fringe is a region no classical state can produce. Autoscaling
here would put zero at an arbitrary color and destroy the one thing the plot
exists to show.
Live figure — pick a tool, then zoom, pan, point-pick or annotate. Nothing is active until a tool is selected.
View this figure’s Vega export ↗ — the raw JSON spec, rendered live by a real Vega engine.
View this figure’s Vega-Lite export ↗ — the raw JSON spec(s), rendered live by a real Vega-Lite engine.
import numpy as np
import polars as pl
import plotpress

ALPHA = 2.0                       # coherent-state amplitude
x0 = np.sqrt(2.0) * ALPHA         # lobe displacement in phase space

x = np.linspace(-5.0, 5.0, 360)
p = np.linspace(-5.0, 5.0, 360)
X, P = np.meshgrid(x, p)

lobes = np.exp(-(X - x0) ** 2 - P ** 2) + np.exp(-(X + x0) ** 2 - P ** 2)
interference = 2.0 * np.exp(-X ** 2 - P ** 2) * np.cos(2.0 * P * x0)
norm = np.pi * 2.0 * (1.0 + np.exp(-2.0 * ALPHA ** 2))

# One row per (x, p) phase-space sample -- sorted before the reshape below so
# the pivot back to a grid is correct regardless of row order.
phase_space = pl.DataFrame({
    "x": X.ravel(),
    "p": P.ravel(),
    "wigner": ((lobes + interference) / norm).ravel(),
}).sort(["p", "x"])

x_axis = phase_space["x"].unique().sort().to_numpy()
p_axis = phase_space["p"].unique().sort().to_numpy()
wigner = phase_space["wigner"].to_numpy().reshape(p_axis.size, x_axis.size)
lim = float(phase_space["wigner"].abs().max())

fig, ax = plotpress.subplots(figsize=(6.6, 5.6))
mesh = ax.pcolormesh(x_axis, p_axis, wigner, cmap="RdBu", vmin=-lim, vmax=lim)
bar = fig.colorbar(mesh, ax=ax)
bar.set_title("W(x, p)")
ax.set_aspect("equal")
ax.set_xlabel("x (quadrature)")
ax.set_ylabel("p (quadrature)")
ax.set_title(f"Even cat state, alpha = {ALPHA:.0f}: negative fringes")
fig.tight_layout()
Total running time of the script: (0 minutes 0.250 seconds)