Note
Go to the end to download the full example code.
Qubit coherence: T1 relaxation and T2 Ramsey fringes
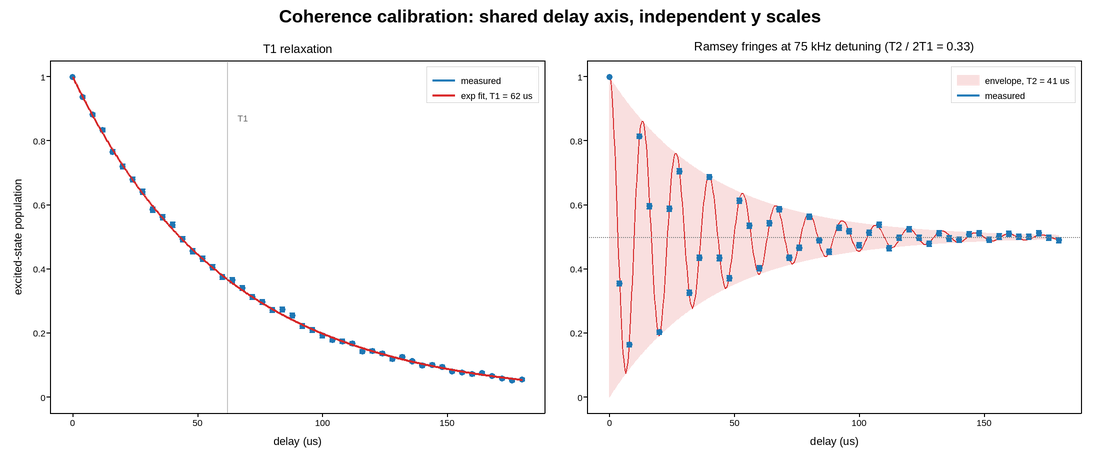
The two measurements that define how good a qubit is, side by side in one
figure. Both are decays, both are fitted, and they belong together because their
ratio is the physically meaningful number: T2 <= 2 T1 always, so a T2 well
below that bound means dephasing rather than energy loss is the limit.
The panels share an x axis via sharex=True, which is not cosmetic – the two
delays are the same physical quantity, and a shared axis means the reader
compares the decay envelopes by eye instead of by reading two sets of tick
labels. They deliberately do not share y: T1 is a population between 0 and 1
that decays monotonically, while the Ramsey signal oscillates about the same
range and is read from its envelope.
The envelope is drawn explicitly on the Ramsey panel with fill_between,
because that is the quantity being fitted; the fringes themselves only encode
the detuning. Error bars come from the shot noise of a few thousand repetitions
per delay point – a binomial variance that is largest near a population of one
half, which is why they widen through the middle of the T1 curve and stay wide
across the whole Ramsey trace.
Live figure — pick a tool, then zoom, pan, point-pick or annotate. Nothing is active until a tool is selected.
View this figure’s Vega export ↗ — the raw JSON spec, rendered live by a real Vega engine.
View this figure’s Vega-Lite export ↗ — the raw JSON spec(s), rendered live by a real Vega-Lite engine.
import numpy as np
import polars as pl
import plotpress

rng = np.random.default_rng(908)

T1 = 62.0                                          # microseconds
T2 = 41.0                                          # microseconds (Ramsey)
DETUNING = 0.075                                   # MHz, deliberately applied
SHOTS = 4000

delay = np.linspace(0.0, 180.0, 46)
fine = np.linspace(0.0, 180.0, 800)


def shot_noise(p):
    """Binomial standard error, and a sampled reading with that spread."""
    sigma = np.sqrt(np.clip(p, 0.0, 1.0) * (1.0 - np.clip(p, 0.0, 1.0)) / SHOTS)
    return sigma, np.clip(p + rng.normal(0.0, np.maximum(sigma, 1e-4)), 0.0, 1.0)


p_t1 = np.exp(-delay / T1)
sigma_t1, meas_t1 = shot_noise(p_t1)

p_t2 = 0.5 + 0.5 * np.exp(-delay / T2) * np.cos(2 * np.pi * DETUNING * delay)
sigma_t2, meas_t2 = shot_noise(p_t2)

# The actual shot table -- one row per delay point actually measured, each
# with its own shot-noise uncertainty. The smooth fit/envelope curves below
# are the theoretical model evaluated on a fine grid for display, not data
# that was collected, so they stay as plain arrays.
shots = pl.DataFrame({
    "delay_us": delay,
    "p_t1": meas_t1,
    "sigma_t1": sigma_t1,
    "p_t2": meas_t2,
    "sigma_t2": sigma_t2,
})

fig, axes = plotpress.subplots(1, 2, figsize=(11.0, 4.6), sharex=True)
ax1, ax2 = axes

ax1.errorbar(shots["delay_us"].to_numpy(), shots["p_t1"].to_numpy(),
             yerr=shots["sigma_t1"].to_numpy(), color="#1f77b4", marker="o",
             markersize=4.0, linestyle="none", capsize=2.5, label="measured")
ax1.plot(fine, np.exp(-fine / T1), color="#d62728", linewidth=1.8,
         label=f"exp fit, T1 = {T1:.0f} us")
ax1.axvline(T1, color="#888888", linestyle=":", linewidth=1.2)
ax1.text(T1 + 4.0, 0.86, "T1", fontsize=9, color="#666666")
ax1.set_ylim(-0.05, 1.05)
ax1.set_xlabel("delay (us)")
ax1.set_ylabel("excited-state population")
ax1.set_title("T1 relaxation")
ax1.legend(loc="upper right")

envelope_hi = 0.5 + 0.5 * np.exp(-fine / T2)
envelope_lo = 0.5 - 0.5 * np.exp(-fine / T2)
ax2.fill_between(fine, envelope_lo, envelope_hi, color="#d62728", alpha=0.15,
                 label=f"envelope, T2 = {T2:.0f} us")
ax2.plot(fine, 0.5 + 0.5 * np.exp(-fine / T2)
         * np.cos(2 * np.pi * DETUNING * fine), color="#d62728", linewidth=1.2)
ax2.errorbar(shots["delay_us"].to_numpy(), shots["p_t2"].to_numpy(),
             yerr=shots["sigma_t2"].to_numpy(), color="#1f77b4", marker="o",
             markersize=4.0, linestyle="none", capsize=2.5, label="measured")
ax2.axhline(0.5, color="#888888", linestyle=":", linewidth=1.0)
ax2.set_ylim(-0.05, 1.05)
ax2.set_xlabel("delay (us)")
ax2.set_title(f"Ramsey fringes at {DETUNING * 1e3:.0f} kHz detuning "
              f"(T2 / 2T1 = {T2 / (2 * T1):.2f})")
ax2.legend(loc="upper right")

fig.suptitle("Coherence calibration: shared delay axis, independent y scales")
fig.tight_layout()
Total running time of the script: (0 minutes 0.179 seconds)