Note
Go to the end to download the full example code.
Randomized benchmarking of a two-qubit gate
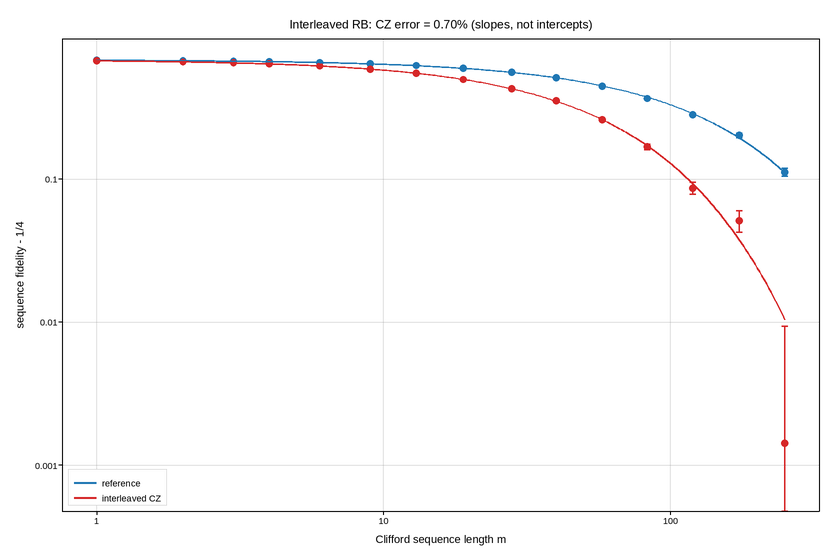
Sequence fidelity against the number of Clifford gates applied, for a reference sequence and for the same sequence with the gate under test interleaved. The difference between the two decay rates is the error of that one gate, isolated from state preparation and measurement errors – which is the whole reason the protocol exists and the whole reason both curves must appear on one axes.
Fidelity decays exponentially in sequence length, so set_yscale("log") makes
each curve a straight line whose slope is its depolarising rate. The comparison
the figure exists to support is between two slopes, and slopes are compared
reliably by eye only when they are straight.
The subtlety is the offset. Fidelity decays toward 1/4 for two qubits, not toward zero, because a fully depolarised state still agrees with the target a quarter of the time. Plotting raw fidelity on a log axis would bend both curves into a floor and destroy the straightness the fit relies on, so what is plotted is the fidelity above that asymptote. Subtracting the right constant is the one step that makes this figure work.
Each point is 40 random sequences; the error bars are the spread across those sequences, which is genuinely large at long lengths and is the reason short sequences alone cannot resolve a small error rate.
Live figure — pick a tool, then zoom, pan, point-pick or annotate. Nothing is active until a tool is selected.
View this figure’s Vega export ↗ — the raw JSON spec, rendered live by a real Vega engine.
View this figure’s Vega-Lite export ↗ — the raw JSON spec(s), rendered live by a real Vega-Lite engine.
import numpy as np
import polars as pl
import plotpress

rng = np.random.default_rng(4096)

ASYMPTOTE = 0.25                                   # two qubits: 1/2^n
A0 = 0.68                                          # SPAM-limited starting amplitude
P_REF = 0.9928                                     # reference depolarising parameter
P_INT = 0.9835                                     # interleaved (worse: gate error)
N_SEQUENCES = 40

lengths = np.unique(np.round(np.logspace(0, 2.4, 16)).astype(int))
fine = np.logspace(0, 2.4, 300)


def decay(m, p):
    return A0 * p ** m + ASYMPTOTE


def measure(p):
    """Sequence-to-sequence scatter grows with length, as different random
    Clifford sequences accumulate coherent errors differently."""
    truth = decay(lengths, p)
    spread = 0.004 + 0.055 * (1.0 - p ** lengths)
    samples = truth[:, None] + rng.normal(0.0, spread[:, None],
                                          (lengths.size, N_SEQUENCES))
    return samples.mean(axis=1), samples.std(axis=1, ddof=1) / np.sqrt(N_SEQUENCES)


ref_mean, ref_err = measure(P_REF)
int_mean, int_err = measure(P_INT)

# Gate error from the ratio of the two decay parameters (d = 4 for two qubits).
gate_error = (1.0 - P_INT / P_REF) * (4.0 - 1.0) / 4.0

# One row per (sequence, curve) point -- the shape the 40-sequences-per-length
# average is actually logged in, before either curve is plotted.
runs = pl.concat([
    pl.DataFrame({"sequence_length": lengths, "curve": "reference",
                  "fidelity": ref_mean, "error": ref_err}),
    pl.DataFrame({"sequence_length": lengths, "curve": "interleaved",
                  "fidelity": int_mean, "error": int_err}),
])

reference = runs.filter(pl.col("curve") == "reference")
interleaved = runs.filter(pl.col("curve") == "interleaved")

fig, ax = plotpress.subplots(figsize=(8.4, 5.6))
ax.errorbar(reference["sequence_length"].to_numpy(),
            reference["fidelity"].to_numpy() - ASYMPTOTE,
            yerr=reference["error"].to_numpy(), color="#1f77b4",
            marker="o", markersize=5.0, linestyle="none", capsize=3.0,
            label="reference")
ax.errorbar(interleaved["sequence_length"].to_numpy(),
            interleaved["fidelity"].to_numpy() - ASYMPTOTE,
            yerr=interleaved["error"].to_numpy(), color="#d62728",
            marker="o", markersize=5.0, linestyle="none", capsize=3.0,
            label="interleaved CZ")
ax.plot(fine, decay(fine, P_REF) - ASYMPTOTE, color="#1f77b4", linewidth=1.5)
ax.plot(fine, decay(fine, P_INT) - ASYMPTOTE, color="#d62728", linewidth=1.5)

ax.set_xscale("log")
ax.set_yscale("log")
ax.set_xlabel("Clifford sequence length m")
ax.set_ylabel("sequence fidelity - 1/4")
ax.set_title(f"Interleaved RB: CZ error = {gate_error * 1e2:.2f}% "
             "(slopes, not intercepts)")
ax.legend(loc="lower left")
ax.grid(True)
fig.tight_layout()
Total running time of the script: (0 minutes 0.127 seconds)