Note
Go to the end to download the full example code.
Airfoil polars at three Reynolds numbers
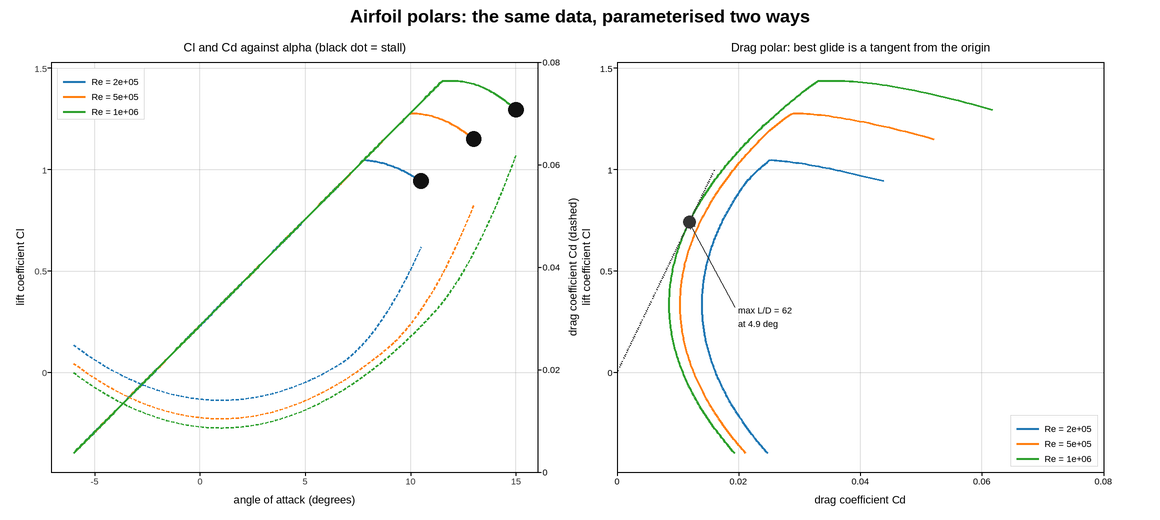
Lift and drag coefficients for a wing section, presented the two ways aerodynamics uses. On the left, both coefficients against angle of attack, sharing the x axis. On the right, the drag polar – lift plotted against drag, with angle of attack becoming a parameter along the curve rather than an axis.
The polar looks like a strange choice until you need what it shows. The best-glide condition is the maximum of lift over drag, which on the polar is simply the point where a line from the origin is tangent to the curve, and that tangent is drawn. Reading the same quantity off the left panel means dividing one curve by another by eye at every angle.
Drag varies by a factor of thirty across the range while lift varies by three,
so on the left panel drag gets its own axis through twinx – otherwise the
drag curve is a flat line along the bottom. The scales are chosen so the drag
bucket is visible, and the axes are colour-matched to their curves because two
scales with unlabelled colours is how twin-axis figures become unreadable.
Stall is where the lift curve stops being straight and turns over. It moves with Reynolds number, which is the reason for showing three, and each curve is terminated at stall rather than extrapolated through it – past stall the flow is separated and unsteady, and a smooth curve there would be fiction.
Live figure — pick a tool, then zoom, pan, point-pick or annotate. Nothing is active until a tool is selected.
View this figure’s Vega export ↗ — the raw JSON spec, rendered live by a real Vega engine.
View this figure’s Vega-Lite export ↗ — the raw JSON spec(s), rendered live by a real Vega-Lite engine.
import numpy as np
import polars as pl
import plotpress

CASES = [
    # Reynolds number, stall angle (deg), max Cl, min Cd,   colour
    (2.0e5, 10.5, 1.05, 0.0140, "#1f77b4"),
    (5.0e5, 13.0, 1.28, 0.0104, "#ff7f0e"),
    (1.0e6, 15.0, 1.44, 0.0086, "#2ca02c"),
]
CL_SLOPE = 0.105                                   # per degree, thin-airfoil theory
ALPHA_ZERO_LIFT = -2.2                             # degrees, cambered section

wind_tunnel = []
for reynolds, stall, cl_max, cd_min, _ in CASES:
    alpha = np.linspace(-6.0, stall, 200)
    cl = CL_SLOPE * (alpha - ALPHA_ZERO_LIFT)
    # Soften the last couple of degrees before stall.
    cl = np.minimum(cl, cl_max * (1.0 - 0.10 * np.clip((alpha - stall + 3.0) / 3.0,
                                                       0.0, 1.0) ** 2))
    cd = cd_min + 2.2e-4 * (alpha - 1.0) ** 2 + 0.010 * np.clip(
        (alpha - stall + 4.0) / 4.0, 0.0, None) ** 2
    # One row per angle-of-attack sweep point -- the shape a wind-tunnel
    # run's own data sheet is in, before it is split by Reynolds number.
    wind_tunnel.append(pl.DataFrame({"reynolds": reynolds, "alpha": alpha,
                                      "cl": cl, "cd": cd}))
sweeps = pl.concat(wind_tunnel)

fig, axes = plotpress.subplots(1, 2, figsize=(11.6, 5.2))
ax_cl, ax_polar = axes
ax_cd = ax_cl.twinx()

for reynolds, stall, cl_max, cd_min, color in CASES:
    run = sweeps.filter(pl.col("reynolds") == reynolds)
    alpha = run["alpha"].to_numpy()
    cl = run["cl"].to_numpy()
    cd = run["cd"].to_numpy()

    label = f"Re = {reynolds:.0e}"
    ax_cl.plot(alpha, cl, color=color, linewidth=1.9, label=label)
    ax_cd.plot(alpha, cd, color=color, linewidth=1.3, linestyle="--")
    ax_cl.scatter([alpha[-1]], [cl[-1]], s=11.0, color="#111111")

    ax_polar.plot(cd, cl, color=color, linewidth=1.9, label=label)
    if reynolds == 1.0e6:
        best = int(np.argmax(cl / cd))
        ax_polar.plot([0.0, cd[best] * 1.35], [0.0, cl[best] * 1.35],
                      color="#333333", linestyle=":", linewidth=1.3)
        ax_polar.scatter([cd[best]], [cl[best]], s=9.0, color="#333333")
        ax_polar.annotate(f"max L/D = {cl[best] / cd[best]:.0f}\n"
                          f"at {alpha[best]:.1f} deg",
                          xy=(cd[best], cl[best]), xytext=(cd[best] + 0.008,
                                                           cl[best] - 0.45),
                          arrowprops={"color": "#333333"}, fontsize=9)

ax_cl.set_xlabel("angle of attack (degrees)")
ax_cl.set_ylabel("lift coefficient Cl")
ax_cl.tick_params(labelcolor="#333333")
ax_cl.set_title("Cl and Cd against alpha (black dot = stall)")
ax_cl.legend(loc="upper left")
ax_cl.grid(True)
ax_cd.set_ylabel("drag coefficient Cd (dashed)")
ax_cd.set_ylim(0.0, 0.08)

ax_polar.set_xlabel("drag coefficient Cd")
ax_polar.set_ylabel("lift coefficient Cl")
ax_polar.set_xlim(0.0, 0.08)
ax_polar.set_title("Drag polar: best glide is a tangent from the origin")
ax_polar.legend(loc="lower right")
ax_polar.grid(True)

fig.suptitle("Airfoil polars: the same data, parameterised two ways")
fig.tight_layout()
Total running time of the script: (0 minutes 0.218 seconds)