Note
Go to the end to download the full example code.
Seismic reflection section
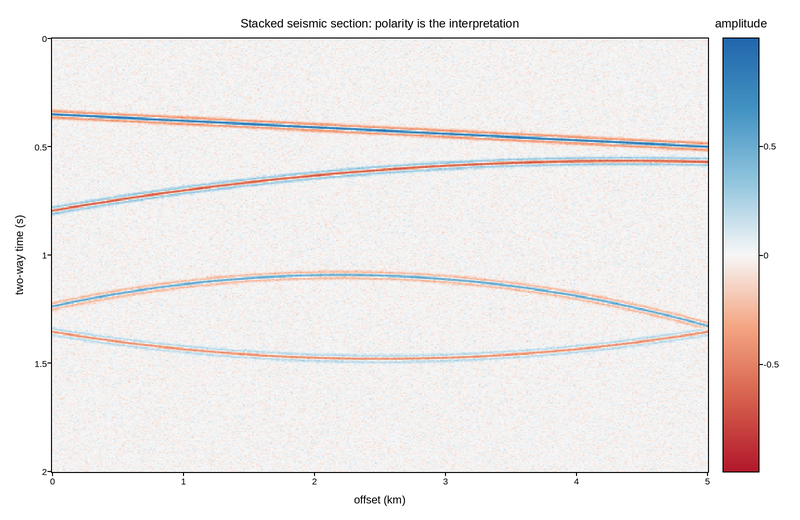
A stacked seismic section: reflection amplitude against surface position and two-way travel time, the standard product of a land or marine survey.
Reflections are band-limited wavelets whose polarity carries the sign of the acoustic-impedance contrast at each interface – a hard layer over a soft one reverses the wiggle. That makes the data genuinely signed, and the sign is the interpretation, so the colour scale is diverging with limits placed symmetrically about zero. Zero amplitude, meaning no reflector, lands on the neutral midpoint instead of drifting to whatever colour an autoscaled range happens to put there.
Travel time increases downward, so the y axis is inverted – depth sections are read from the surface down.
Live figure — pick a tool, then zoom, pan, point-pick or annotate. Nothing is active until a tool is selected.
View this figure’s Vega export ↗ — the raw JSON spec, rendered live by a real Vega engine.
View this figure’s Vega-Lite export ↗ — the raw JSON spec(s), rendered live by a real Vega-Lite engine.
import numpy as np
import polars as pl
import plotpress

rng = np.random.default_rng(7)
x = np.linspace(0.0, 5.0, 360)        # surface position (km)
t = np.linspace(0.0, 2.0, 400)        # two-way travel time (s)
X, T = np.meshgrid(x, t)

FREQ = 28.0                            # dominant wavelet frequency (Hz)


def ricker(tau):
    """Zero-phase Ricker wavelet, the usual seismic source approximation."""
    a = (np.pi * FREQ * tau) ** 2
    return (1.0 - 2.0 * a) * np.exp(-a)


# Dipping and folded reflectors, each with its own impedance contrast.
section = np.zeros_like(X)
for t0, dip, curve, refl in [(0.35, 0.030, 0.000, 0.9),
                             (0.72, -0.045, 0.012, -0.7),
                             (1.05, 0.018, 0.030, 0.55),
                             (1.48, 0.000, -0.020, -0.45)]:
    horizon = t0 + dip * X + curve * (X - 2.5) ** 2
    section += refl * ricker(T - horizon)

section += 0.04 * rng.standard_normal(section.shape)   # ambient noise

# One row per (offset, time) trace sample -- sorted before the reshape
# below so the pivot back to a grid is correct regardless of row order.
traces = pl.DataFrame({
    "offset_km": X.ravel(), "time_s": T.ravel(), "amplitude": section.ravel(),
}).sort(["time_s", "offset_km"])

offset_axis = traces["offset_km"].unique().sort().to_numpy()
time_axis = traces["time_s"].unique().sort().to_numpy()
section = traces["amplitude"].to_numpy().reshape(time_axis.size, offset_axis.size)
lim = float(traces["amplitude"].abs().max())

fig, ax = plotpress.subplots(figsize=(8.0, 5.2))
mesh = ax.pcolormesh(offset_axis, time_axis, section, cmap="RdBu", vmin=-lim, vmax=lim)
bar = fig.colorbar(mesh, ax=ax)
bar.set_title("amplitude")
ax.invert_yaxis()
ax.set_xlabel("offset (km)")
ax.set_ylabel("two-way time (s)")
ax.set_title("Stacked seismic section: polarity is the interpretation")
fig.tight_layout()
Total running time of the script: (0 minutes 0.411 seconds)