Note
Go to the end to download the full example code.
Interferometer point-spread function (LogNorm)
The synthesised beam of a radio interferometer: the point-spread function you get by Fourier-transforming the array’s uv coverage. An interferometer samples only the spatial frequencies its baselines reach, so the PSF is not a clean Airy pattern but a narrow core surrounded by sidelobes – the “dirty beam” that deconvolution has to remove.
Its dynamic range is the point. The core is unity by construction and the
sidelobes run from a few percent down to the 1e-4 floor, so a linear scale
shows a bright dot on black and hides the very structure that limits image
fidelity. LogNorm puts four decades on equal footing.
Log scaling needs positive data, so the beam is plotted as abs: for a
sidelobe what matters here is its magnitude, not whether it is a positive or
negative excursion.
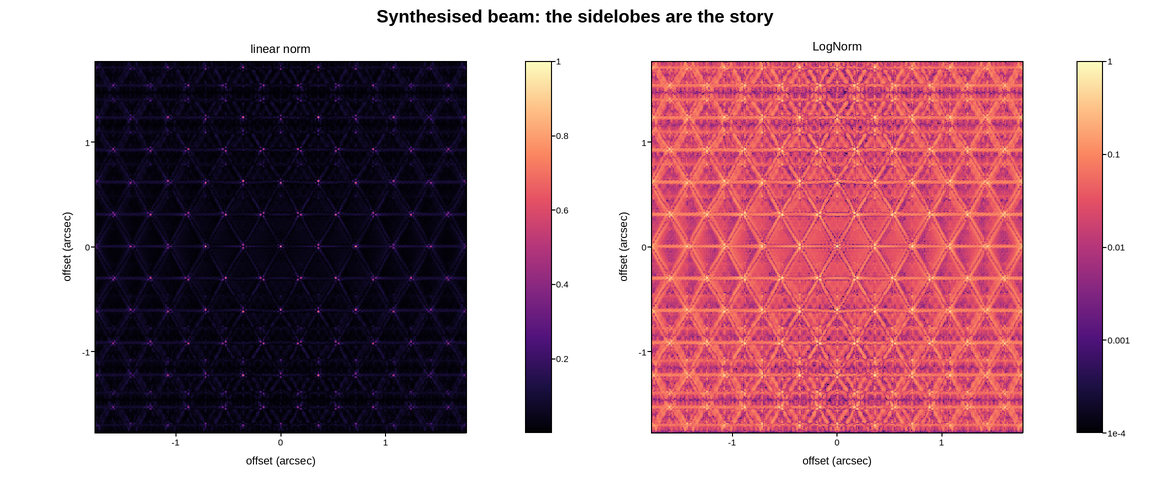
Live figure — pick a tool, then zoom, pan, point-pick or annotate. Nothing is active until a tool is selected.
View this figure’s Vega export ↗ — the raw JSON spec, rendered live by a real Vega engine.
View this figure’s Vega-Lite export ↗ — the raw JSON spec(s), rendered live by a real Vega-Lite engine.
import numpy as np
import polars as pl
import plotpress

rng = np.random.default_rng(3)
N = 384

# A sparse Y-shaped array: three arms of antennas, all baselines between them.
arms = []
for angle in (90.0, 210.0, 330.0):
    t = np.linspace(0.15, 1.0, 9)
    arms.append(np.stack([t * np.cos(np.radians(angle)),
                          t * np.sin(np.radians(angle))], axis=1))
ant = np.concatenate(arms)
d = ant[:, None, :] - ant[None, :, :]
u, v = d[..., 0].ravel(), d[..., 1].ravel()
u, v = u[u ** 2 + v ** 2 > 0], v[u ** 2 + v ** 2 > 0]

# Grid the uv samples, then transform to the image plane.
grid = np.zeros((N, N))
scale = (N / 2 - 4) / np.abs(np.concatenate([u, v])).max()
iu = np.clip((u * scale + N / 2).astype(int), 0, N - 1)
iv = np.clip((v * scale + N / 2).astype(int), 0, N - 1)
np.add.at(grid, (iv, iu), 1.0)

beam = np.abs(np.fft.fftshift(np.fft.ifft2(np.fft.ifftshift(grid))))
beam /= beam.max()
beam = np.maximum(beam, 1e-4)          # floor, so the log scale has a bottom

extent = N / (2.0 * scale)             # arcsec-like image coordinates
axis = np.linspace(-extent, extent, N)
X, Y = np.meshgrid(axis, axis)

# One row per synthesised-image pixel -- the shape an imager's own beam
# export is in, before it is gridded for the mesh.
image = pl.DataFrame({"x": X.ravel(), "y": Y.ravel(), "beam": beam.ravel()}) \
    .sort(["y", "x"])
axis = image["x"].unique().sort().to_numpy()
beam = image["beam"].to_numpy().reshape(axis.size, axis.size)

fig, axes = plotpress.subplots(1, 2, figsize=(11.5, 4.8))
lin = axes[0].pcolormesh(axis, axis, beam, cmap="magma")
axes[0].set_title("linear norm")
fig.colorbar(lin, ax=axes[0])
log = axes[1].pcolormesh(axis, axis, beam, cmap="magma", norm=plotpress.LogNorm())
axes[1].set_title("LogNorm")
fig.colorbar(log, ax=axes[1])
for ax in axes:
    ax.set_aspect("equal")
    ax.set_xlabel("offset (arcsec)")
    ax.set_ylabel("offset (arcsec)")
fig.suptitle("Synthesised beam: the sidelobes are the story")
fig.tight_layout()
Total running time of the script: (0 minutes 0.542 seconds)