Note
Go to the end to download the full example code.
AllXY calibration sweep: amplitude scaling error across 21 sequences
The AllXY sequence applies 21 fixed pairs of pulses, each with a known ideal outcome of 0, 1/2, or 1 – a small enough set that a single well-calibrated run is normally read as one 21-point trace. Sweeping the pulse amplitude scale factor alongside it turns that check into a map: each sequence responds to an amplitude error with its own sign and sensitivity (some pairs are amplitude-insensitive by construction, others rotate twice as far off target for the same error), so at any amplitude scale away from 1.0 the whole pattern smears away from its ideal step structure. The correct scale factor is the one vertical slice where every row simultaneously sits at its ideal value – which is the entire diagnostic power of AllXY: it does not just flag that something is off, the pattern of which sequences deviate and by how much says what kind of error it is.
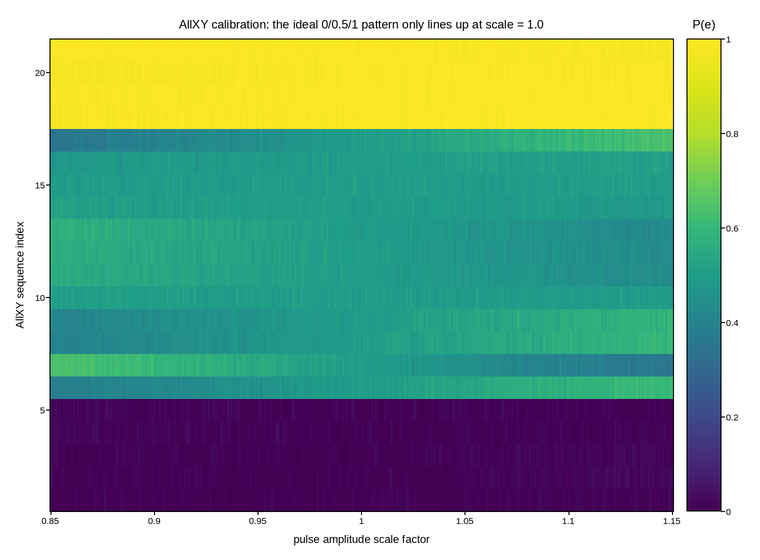
Live figure — pick a tool, then zoom, pan, point-pick or annotate. Nothing is active until a tool is selected.
View this figure’s Vega export ↗ — the raw JSON spec, rendered live by a real Vega engine.
View this figure’s Vega-Lite export ↗ — the raw JSON spec(s), rendered live by a real Vega-Lite engine.
import numpy as np
import polars as pl
import plotpress

N_SEQ = 21
rng = np.random.default_rng(7)

# A schematic version of the real AllXY step structure: five ideal-0 pairs,
# twelve ideal-0.5 pairs, four ideal-1 pairs -- and a per-sequence amplitude
# sensitivity (sign and size) modelled on which pairs the real sequence
# leaves amplitude-sensitive.
ideal = np.array([0, 0, 0, 0, 0] + [0.5] * 12 + [1, 1, 1, 1], dtype=float)
sensitivity = rng.uniform(-1.0, 1.0, N_SEQ)
sensitivity[:5] *= 0.15     # the ideal-0/ideal-1 pairs are far less sensitive
sensitivity[-4:] *= 0.15

scale = np.linspace(0.85, 1.15, 320)     # pulse amplitude scale factor
sequence = np.arange(1, N_SEQ + 1)
SCALE, SEQ = np.meshgrid(scale, sequence)

idx = SEQ.astype(int) - 1
response = ideal[idx] + sensitivity[idx] * (SCALE - 1.0)
response = np.clip(response, 0.0, 1.0)
response += rng.normal(0.0, 0.012, response.shape)

# One row per swept (scale, sequence index) shot -- sorted before the
# reshape below so the pivot back to a grid is correct regardless of order.
sweep = pl.DataFrame({
    "amp_scale": SCALE.ravel(),
    "sequence_index": SEQ.ravel(),
    "response": response.ravel(),
}).sort(["sequence_index", "amp_scale"])

scale_axis = sweep["amp_scale"].unique().sort().to_numpy()
sequence_axis = sweep["sequence_index"].unique().sort().to_numpy()
response = sweep["response"].to_numpy().reshape(sequence_axis.size, scale_axis.size)

fig, ax = plotpress.subplots(figsize=(7.6, 5.6))
mesh = ax.pcolormesh(scale_axis, sequence_axis, response, cmap="viridis", vmin=0.0, vmax=1.0)
bar = fig.colorbar(mesh, ax=ax)
bar.set_title("P(e)")
ax.set_xlabel("pulse amplitude scale factor")
ax.set_ylabel("AllXY sequence index")
ax.set_title("AllXY calibration: the ideal 0/0.5/1 pattern only lines up at scale = 1.0")
fig.tight_layout()
Total running time of the script: (0 minutes 0.124 seconds)