Note
Go to the end to download the full example code.
Purity RB: separating coherent from incoherent gate error
Standard RB fidelity and purity RB “unitarity” decay, plotted together against sequence length – the pair of curves that separates how much error a gate set has from what kind it is. Fidelity decays at a rate set by the total error, coherent and incoherent alike; purity, measured from the length of the Bloch vector each sequence leaves behind rather than from a single population readout, decays only from the incoherent part, since a purely coherent over-rotation shrinks the average fidelity across random sequences without ever shrinking any individual sequence’s own Bloch vector. A purity decay visibly slower than the fidelity decay – exactly the gap plotted here – is the standard diagnostic that a gate set’s error budget is dominated by coherent miscalibration (an amplitude or phase left slightly wrong) rather than genuine decoherence, and is worth chasing with DRAG coefficient calibration from amplified leakage-style recalibration rather than accepted as a hardware limit.
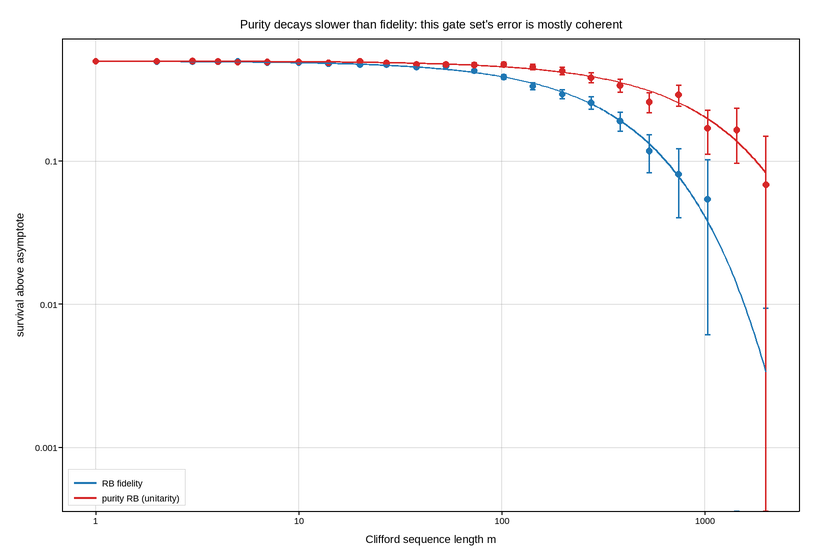
Live figure — pick a tool, then zoom, pan, point-pick or annotate. Nothing is active until a tool is selected.
View this figure’s Vega export ↗ — the raw JSON spec, rendered live by a real Vega engine.
View this figure’s Vega-Lite export ↗ — the raw JSON spec(s), rendered live by a real Vega-Lite engine.
import numpy as np
import polars as pl
import plotpress

ASYMPTOTE = 0.5
P_FIDELITY = 0.9975               # depolarizing parameter from standard RB
P_UNITARITY = 0.9991                # slower decay: most error here is coherent
rng = np.random.default_rng(1607)

lengths = np.unique(np.round(np.logspace(0, 3.3, 24)).astype(int))

fidelity = ASYMPTOTE + (1.0 - ASYMPTOTE) * P_FIDELITY ** lengths
unitarity = ASYMPTOTE + (1.0 - ASYMPTOTE) * P_UNITARITY ** lengths

f_err = 0.01 * np.sqrt(lengths / lengths[0])
u_err = 0.012 * np.sqrt(lengths / lengths[0])
fidelity_meas = np.clip(fidelity + rng.normal(0.0, f_err * 0.15), 0.0, 1.0)
unitarity_meas = np.clip(unitarity + rng.normal(0.0, u_err * 0.15), 0.0, 1.0)

# One row per (sequence length, curve) measurement -- the shape the two
# decay curves are actually logged in, before either is plotted.
runs = pl.concat([
    pl.DataFrame({"sequence_length": lengths, "curve": "fidelity",
                  "value": fidelity_meas, "error": f_err * 0.15}),
    pl.DataFrame({"sequence_length": lengths, "curve": "unitarity",
                  "value": unitarity_meas, "error": u_err * 0.15}),
])

fidelity_run = runs.filter(pl.col("curve") == "fidelity")
unitarity_run = runs.filter(pl.col("curve") == "unitarity")

fig, ax = plotpress.subplots(figsize=(8.2, 5.6))
ax.errorbar(fidelity_run["sequence_length"].to_numpy(),
            fidelity_run["value"].to_numpy() - ASYMPTOTE,
            yerr=fidelity_run["error"].to_numpy(), color="#1f77b4",
            marker="o", markersize=4.5, linestyle="none", capsize=2.5,
            label="RB fidelity")
ax.errorbar(unitarity_run["sequence_length"].to_numpy(),
            unitarity_run["value"].to_numpy() - ASYMPTOTE,
            yerr=unitarity_run["error"].to_numpy(), color="#d62728",
            marker="o", markersize=4.5, linestyle="none", capsize=2.5,
            label="purity RB (unitarity)")
fine = np.logspace(0, 3.3, 300)
ax.plot(fine, (1.0 - ASYMPTOTE) * P_FIDELITY ** fine, color="#1f77b4", linewidth=1.3)
ax.plot(fine, (1.0 - ASYMPTOTE) * P_UNITARITY ** fine, color="#d62728", linewidth=1.3)

ax.set_xscale("log")
ax.set_yscale("log")
ax.set_xlabel("Clifford sequence length m")
ax.set_ylabel("survival above asymptote")
ax.set_title("Purity decays slower than fidelity: this gate set's error is mostly coherent")
ax.legend(loc="lower left")
ax.grid(True)
fig.tight_layout()
Total running time of the script: (0 minutes 0.153 seconds)