Note
Go to the end to download the full example code.
Font metrics: which families plotpress can measure
A figure is laid out before anything draws its glyphs: SVG emits <text>
and lets the viewer rasterize. So plotpress has to predict how wide text
will be, and it predicts from bundled advance-width tables.
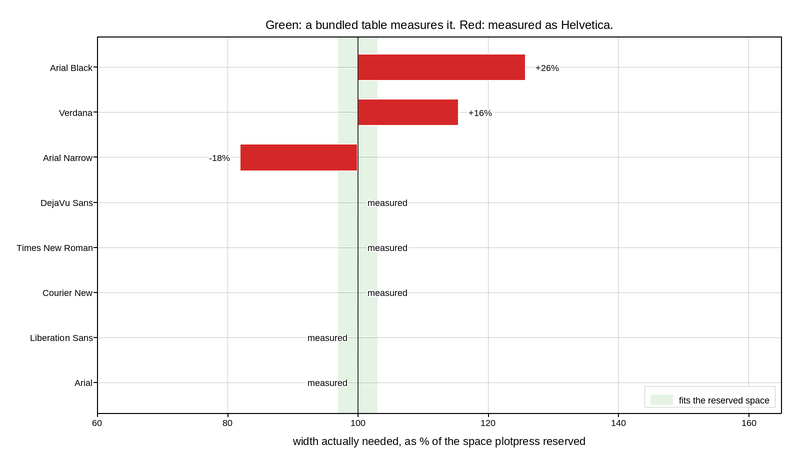
It bundles the base-14 metric families – Helvetica, Times and Courier, each in regular / bold / italic / bold-italic – plus DejaVu Sans. A family that resolves to one of those is measured exactly. A family that resolves to none of them is measured as Helvetica, and that is where layout goes wrong: the figure still renders, but legend boxes and axis margins were sized for the wrong font.
The chart below shows how much room each family actually needs, as a percentage of what the layout reserved. Anything past 100% overflows its box; anything well under wastes margin.
import numpy as np
import plotpress

# Percentages are hard-coded so this example renders identically everywhere,
# including doc builders that have none of these fonts installed. The measured
# families sit at 100% by construction: plotpress reserves space using the very
# table that describes them. The fallback figures are their true widths relative
# to Helvetica, which is what gets reserved on their behalf.
FAMILIES = [
    ("Arial", 99.9, True),
    ("Liberation Sans", 99.9, True),
    ("Courier New", 100.0, True),
    ("Times New Roman", 100.0, True),
    ("DejaVu Sans", 100.0, True),
    ("Arial Narrow", 81.9, False),
    ("Verdana", 115.5, False),
    ("Arial Black", 125.8, False),
]
SAFE_BAND = 3.0          # within a few % the difference is invisible

names = [n for n, _, _ in FAMILIES]
pct = np.array([p for _, p, _ in FAMILIES])
measured = [m for _, _, m in FAMILIES]
y = np.arange(len(names))

fig, ax = plotpress.subplots(figsize=(8.0, 4.6))

# Shade the band where a family is effectively interchangeable with what was
# reserved for it.
ax.axvspan(100 - SAFE_BAND, 100 + SAFE_BAND, color="#2ca02c", alpha=0.13,
           label="fits the reserved space")

colors = ["#2ca02c" if m else "#d62728" for m in measured]
ax.barh(y, pct - 100, height=0.6, left=100, color=colors, edgecolor="#ffffff",
        linewidth=0.8)
ax.axvline(100, color="#333333", linewidth=1.2, linestyle="-")

for i, (p, m) in enumerate(zip(pct, measured)):
    over = p - 100
    label = "measured" if m else f"{over:+.0f}%"
    ax.text(p + (1.5 if over >= 0 else -1.5), i, label,
            ha="left" if over >= 0 else "right", va="center", fontsize=9)

ax.set_yticks(y)
ax.set_yticklabels(names)
ax.set_xlim(60, 165)
ax.set_xlabel("width actually needed, as % of the space plotpress reserved")
ax.set_title("Green: a bundled table measures it. Red: measured as Helvetica.")
ax.grid(True)
ax.legend(loc="lower right")
fig.tight_layout()
Live figure — pick a tool, then zoom, pan, point-pick or annotate. Nothing is active until a tool is selected.
View this figure’s Vega export ↗ — the raw JSON spec, rendered live by a real Vega engine.
View this figure’s Vega-Lite export ↗ — the raw JSON spec(s), rendered live by a real Vega-Lite engine.
Reading it
Arial and Liberation Sans are metric-compatible with Helvetica by design – they agree to within 0.1%, so the default stack
"Helvetica, Arial, sans-serif"is accurate everywhere.Courier New, Times New Roman and DejaVu Sans each resolve to their own bundled table, so they are measured exactly too. Courier New used to be the worst case here, needing ~46% more room than was reserved.
Verdana, Arial Black and Arial Narrow have proprietary metrics that match nothing bundled, so they fall back to Helvetica and stay wrong – the first two overflow, the third wastes margin. Ugly rather than broken.
If you want a different look, prefer a family in the green group. Everything
else renders, but you should expect to hand-tune figsize and margins.
Weight matters too
Bold is not a free variation on regular: Helvetica-Bold runs 5-9% wider on
realistic label strings. plotpress bundles the bold tables and measures the
elements it draws bold – the legend title and suptitle – with them.
The second limitation: pixel rounding
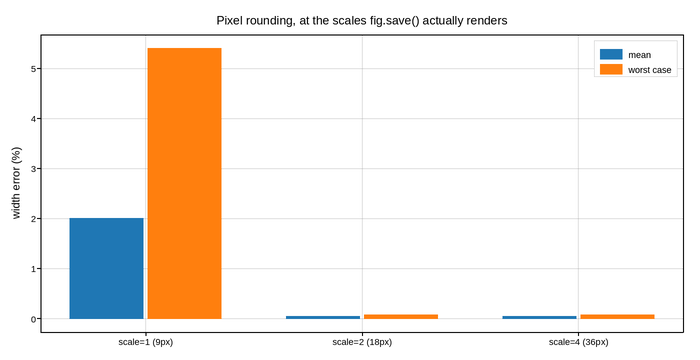
Even a perfectly compatible font drifts a little, because renderers round each
glyph’s advance to a whole pixel while the metrics table is continuous. The
error is largest when glyphs are only a few pixels wide, and it washes out as
text gets bigger – which is why PNG export supersamples (scale=2 by
default) before downsampling.
We can model it exactly, with no font files involved: ask text_width for
each glyph and round it, which is what a renderer does.
from plotpress.fonts import text_width

SAMPLES = ["1.002e5", "y axis label", "a series label", "-0.5", "Wwwiii",
           "0.002", "temperature (K)", "Title of the plot", "1000", "-1e5"]


def quantized_width(text, size):
    """Width once each glyph advance is rounded to a whole pixel."""
    return sum(round(text_width(ch, size)) for ch in text)


scales = [1, 2, 4]
mean_err, worst_err = [], []
for scale in scales:
    px = 9 * scale                     # tick labels are 9px at scale=1
    e = [abs(quantized_width(s, px) - text_width(s, px)) / text_width(s, px) * 100
         for s in SAMPLES]
    mean_err.append(np.mean(e))
    worst_err.append(max(e))

x = np.arange(len(scales))
fig2, ax2 = plotpress.subplots(figsize=(7.0, 3.6))
ax2.bar(x - 0.18, mean_err, width=0.34, label="mean")
ax2.bar(x + 0.18, worst_err, width=0.34, label="worst case")
ax2.set_xticks(x)
ax2.set_xticklabels([f"scale={s} ({9 * s}px)" for s in scales])
ax2.set_ylabel("width error (%)")
ax2.set_title("Pixel rounding, at the scales fig.save() actually renders")
ax2.grid(True)
ax2.legend()
fig2.tight_layout()
Live figure — pick a tool, then zoom, pan, point-pick or annotate. Nothing is active until a tool is selected.
View this figure’s Vega export ↗ — the raw JSON spec, rendered live by a real Vega engine.
View this figure’s Vega-Lite export ↗ — the raw JSON spec(s), rendered live by a real Vega-Lite engine.
The default (scale=2) already reduces this to ~0.1% – it is effectively
gone, and it never causes overlap in any case. Only scale=1 shows it at
all. So of the two limitations on this page, only the family mismatch is
worth designing around.
(The rounding model matches real rendering exactly at 12px and above; below
that, font hinting departs from linear scaling and it becomes an estimate –
which is why the scale=1 bars are indicative rather than precise.)
Total running time of the script: (0 minutes 0.123 seconds)