Note
Go to the end to download the full example code.
Manual axes positioning
set_position places an axes at an explicit (left, bottom, width,
height) and opts it out of auto-layout – a later tight_layout/
subplots_adjust call leaves it exactly where it was put, while every
other grid axes still auto-fits normally.
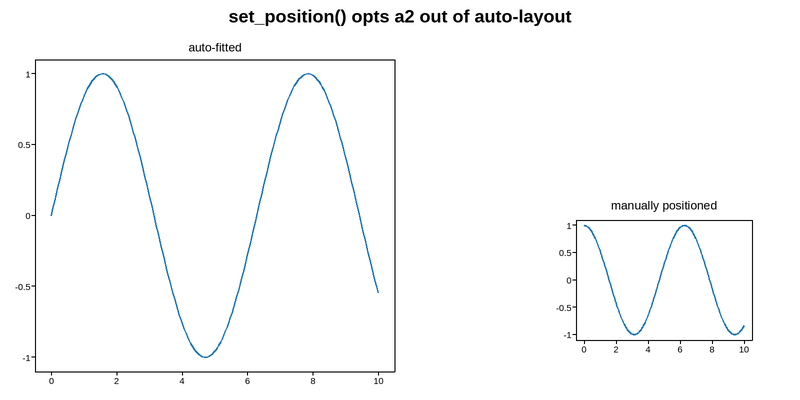
Live figure — pick a tool, then zoom, pan, point-pick or annotate. Nothing is active until a tool is selected.
View this figure’s Vega export ↗ — the raw JSON spec, rendered live by a real Vega engine.
View this figure’s Vega-Lite export ↗ — the raw JSON spec(s), rendered live by a real Vega-Lite engine.
import numpy as np
import plotpress

x = np.linspace(0, 10, 200)

fig, (a1, a2) = plotpress.subplots(1, 2, figsize=(8, 4))
a1.plot(x, np.sin(x))
a1.set_title("auto-fitted")
a2.plot(x, np.cos(x))
a2.set_title("manually positioned")

a2.set_position((0.72, 0.15, 0.22, 0.3))   # shrink it into a corner
fig.tight_layout()   # a1 still auto-fits; a2 stays exactly where it was put
fig.suptitle("set_position() opts a2 out of auto-layout")
Total running time of the script: (0 minutes 0.059 seconds)