Note
Go to the end to download the full example code.
Secondary axis
secondary_xaxis/secondary_yaxis mirror this axes’ data range onto
another edge – same units, no data of their own. plotpress doesn’t support
matplotlib’s functional unit-conversion (functions=), but the secondary
axis’s own tick locations and labels are still yours to choose, which
covers a lot of “second scale” needs anyway – like marking week boundaries
on a plot whose x-axis is really counting days.
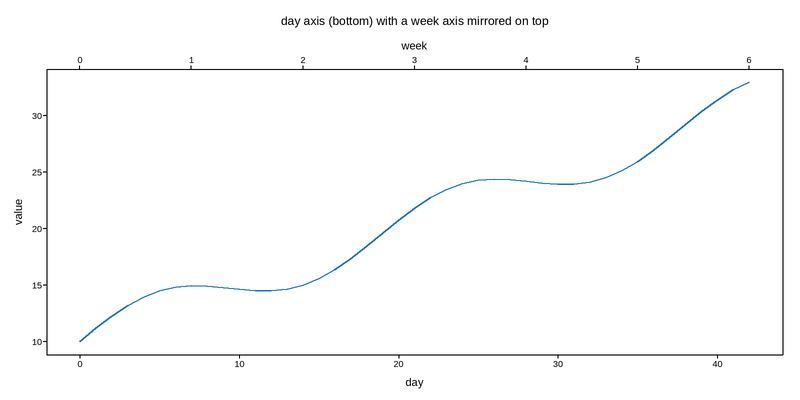
Live figure — pick a tool, then zoom, pan, point-pick or annotate. Nothing is active until a tool is selected.
View this figure’s Vega export ↗ — the raw JSON spec, rendered live by a real Vega engine.
View this figure’s Vega-Lite export ↗ — the raw JSON spec(s), rendered live by a real Vega-Lite engine.
import numpy as np
import plotpress

days = np.arange(0, 43)
value = 10 + 0.5 * days + np.sin(days / 3.0) * 2

fig, ax = plotpress.subplots(figsize=(8, 4))
ax.plot(days, value)
ax.set_xlabel("day")
ax.set_ylabel("value")

week_marks = np.arange(0, 43, 7)
weeks = ax.secondary_xaxis("top", label="week")
weeks.set_xticks(week_marks, [str(d // 7) for d in week_marks])

ax.set_title("day axis (bottom) with a week axis mirrored on top")
fig.tight_layout()
Total running time of the script: (0 minutes 0.068 seconds)