Note
Go to the end to download the full example code.
Power spectral density
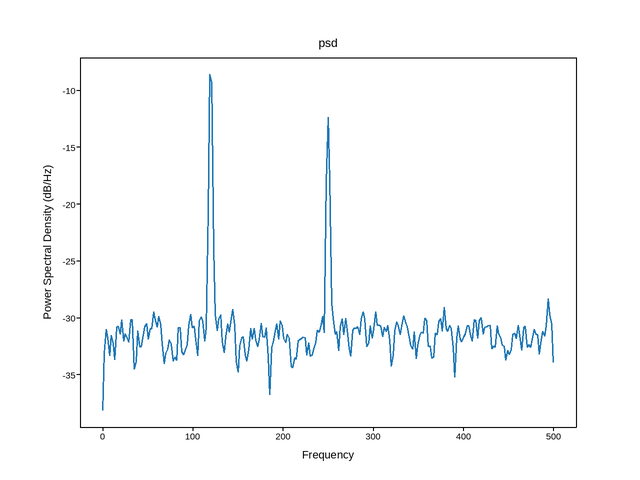
Live figure — pick a tool, then zoom, pan, point-pick or annotate. Nothing is active until a tool is selected.
View this figure’s Vega export ↗ — the raw JSON spec, rendered live by a real Vega engine.
View this figure’s Vega-Lite export ↗ — the raw JSON spec(s), rendered live by a real Vega-Lite engine.
import numpy as np
import plotpress

rng = np.random.default_rng(0)
Fs = 1000.0
t = np.arange(0, 4, 1 / Fs)
x = np.sin(2 * np.pi * 120 * t) + 0.6 * np.sin(2 * np.pi * 250 * t)
x += 0.6 * rng.standard_normal(t.size)

fig, ax = plotpress.subplots()
ax.psd(x, NFFT=512, Fs=Fs, noverlap=256, color="C0")
ax.set_title("psd")
Total running time of the script: (0 minutes 0.054 seconds)