Note
Go to the end to download the full example code.
Shared colorbar over a grid
One colorbar describing a whole grid of axes – pass the list of axes and
plotpress squeezes the grid to make room. All panels share vmin/vmax.
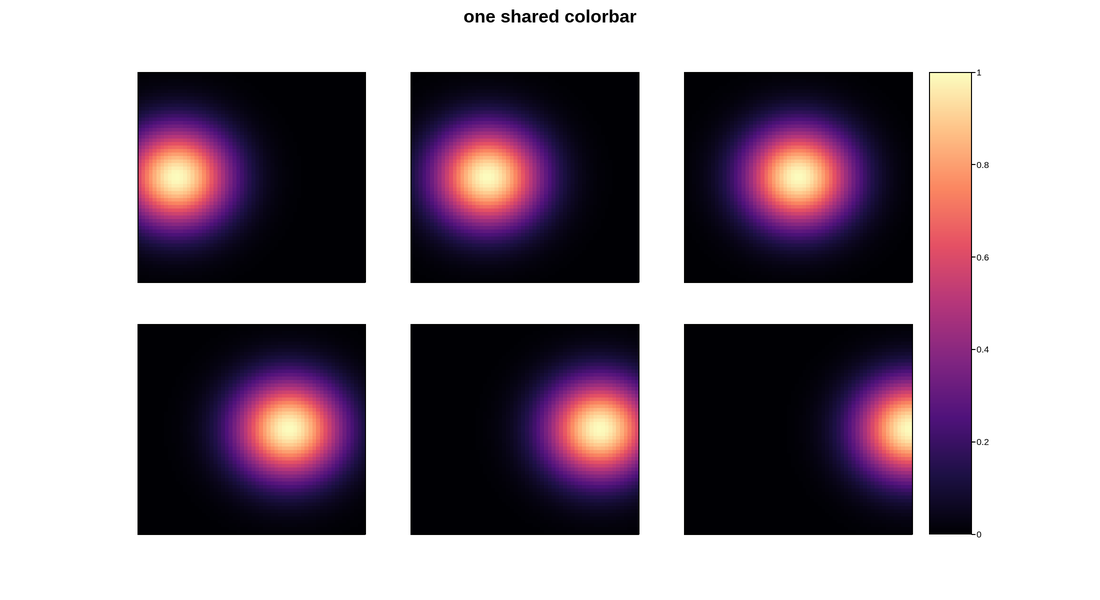
Live figure — pick a tool, then zoom, pan, point-pick or annotate. Nothing is active until a tool is selected.
View this figure’s Vega export ↗ — the raw JSON spec, rendered live by a real Vega engine.
View this figure’s Vega-Lite export ↗ — the raw JSON spec(s), rendered live by a real Vega-Lite engine.
import numpy as np
import plotpress

g = np.linspace(-3, 3, 60)
X, Y = np.meshgrid(g, g)

fig, axes = plotpress.subplots(2, 3, figsize=(11, 6))
m = None
for k, ax in enumerate(axes.ravel()):
    Z = np.exp(-((X - (k - 2)) ** 2 + Y ** 2) / 2.0)
    m = ax.pcolormesh(g, g, Z, cmap="magma", vmin=0, vmax=1)
    ax.set_xticks([])
    ax.set_yticks([])
fig.colorbar(m, ax=axes)
fig.suptitle("one shared colorbar")
Total running time of the script: (0 minutes 0.168 seconds)