Note
Go to the end to download the full example code.
Replacing the toolbar entirely with your own JS
include_default_js=False drops plotpress’s own toolbar/pan/zoom/pick JS
from the page altogether – extra_js becomes the only interactivity
this page gets, built from scratch against the raw #plotpress-meta
JSON payload (per-axes pixel rect and data limits) and #plotpress-svg
directly, rather than extending what plotpress already provides (see
plot_01_add_a_measure_tool for that side of it).
binary_pick_data=False is worth pairing with this: the default packs
long numeric arrays (mesh z grids, big series) as base64 float16/32 for
size, which needs plotpress’s own decoder – exactly what dropping the
built-in JS is turning off. Plain JSON is what a from-scratch script can
actually read.
The click handler below re-derives data coordinates from a click’s pixel
position the same way plotpress’s own JS does internally (m.xmin +
(p.x - m.x) / m.w * (m.xmax - m.xmin), and the mirrored, y-flipped form
for the y axis) – deliberately simplified to the linear, non-inverted
case for clarity; a log-scale or inverted axis needs the same forward/
inverse mapping _interactive.py’s own edges()/toData() apply,
which this recreates just enough of to make the point, not replaces
wholesale.
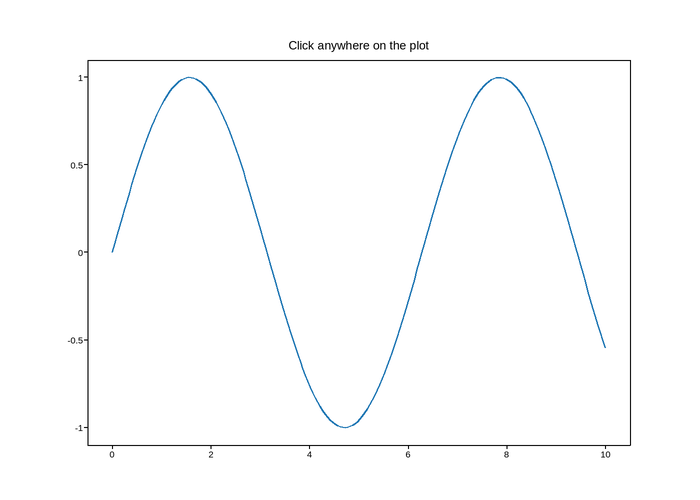
Live figure — pick a tool, then zoom, pan, point-pick or annotate. Nothing is active until a tool is selected.
View this figure’s Vega export ↗ — the raw JSON spec, rendered live by a real Vega engine.
View this figure’s Vega-Lite export ↗ — the raw JSON spec(s), rendered live by a real Vega-Lite engine.
import os
import tempfile

import numpy as np
import plotpress

fig, ax = plotpress.subplots(figsize=(7, 5))
x = np.linspace(0, 10, 200)
ax.plot(x, np.sin(x))
ax.set_title("Click anywhere on the plot")

extra_js = """
(function () {
  var svg = document.getElementById('plotpress-svg');
  var meta = JSON.parse(document.getElementById('plotpress-meta').textContent);
  var readout = document.createElement('div');
  readout.style.cssText = 'position:fixed;top:10px;left:10px;background:#111;' +
    'color:#fff;padding:6px 10px;border-radius:4px;font:13px sans-serif;';
  readout.textContent = 'Click the plot';
  document.body.appendChild(readout);

  function toUser(e) {
    var pt = svg.createSVGPoint();
    pt.x = e.clientX; pt.y = e.clientY;
    return pt.matrixTransform(svg.getScreenCTM().inverse());
  }

  svg.addEventListener('click', function (e) {
    var p = toUser(e);
    for (var key in meta) {
      var m = meta[key];
      if (p.x >= m.x && p.x <= m.x + m.w && p.y >= m.y && p.y <= m.y + m.h) {
        var dataX = m.xmin + (p.x - m.x) / m.w * (m.xmax - m.xmin);
        var dataY = m.ymax - (p.y - m.y) / m.h * (m.ymax - m.ymin);
        readout.textContent = 'x=' + dataX.toFixed(2) + ', y=' + dataY.toFixed(2);
        return;
      }
    }
  });
})();
"""

path = os.path.join(tempfile.gettempdir(), "plotpress_gallery_custom_js.html")
fig.save(path, interactive=True, include_default_js=False,
         binary_pick_data=False, extra_js=extra_js)
Total running time of the script: (0 minutes 0.055 seconds)